|
Reference - Repost - Originally From: A Very Interesting Site- Handprint.comOverview of the GalaxyNote: This page is a draft (October 2015), incomplete sections are flagged: [DRAFT]. This page outlines the features and structures of the Galaxy as they are conceived by modern astronomy: a single, gravitationally bound system of enormous mass, energy and dimensions. The presentation begins and concludes with the Milky Way, the Galaxy as it appears to the naked eye from our location near the Sun. Many basic research papers are linked from Further Reading at the bottom of this page, with instructions on how to find papers of interest online. From the Milky Way to the GalaxyTo the naked eye, our Galaxy appears as the Milky Way: an irregular, unevenly luminous band of dim light. Invisible from urban habitats and barely visible from many suburban locations, the Milky Way is actually bright enough, when located at the zenith of a dark sky site on a moonless night, to cast shadows on the ground. It will be useful to summarize briefly how our understanding has progressed from this naked eye view to the Galaxy model of modern astronomy. The Naked Eye Era. The earliest and one of the finest naked eye descriptions of the Milky Way appears in Ptolemy's Almagest (c.150 CE). Ptolemy's intention was to carefully describe and measure the naked eye celestial sphere, which is the foundational task of every aspect of astronomy � first, describe or measure as clearly as possible what appears in the sky, then use all available knowledge to interpret its physical nature and origin. His description begins this way: "It is easily seen that the Milky Way is not simply a circle but a zone having quite the color of milk, whence its name; and that it is not regular and ordered, but different in width, color, density, and position; and that in one part it is double. These particulars we find in need of careful observation. Now, the double part of this zone has one of its junctions near the Censer [Ara] and the other at the Bird [Cygnus]. The western zone nowhere touches the other, for it divides at the junction at the Censer and at the junction at the Bird, the eastern zone joining the other part of the Milky Way and making one zone which the great circle drawn in its middle would traverse. We shall first discuss this zone beginning with its southernmost parts. These parts go through the Centaur's feet, and are thinner and fainter. The star in the bend of the right hind-foot is a little south of the northern line of the Milky Way; likewise the star in the left fore-knee and the star under the right hind-ankle. The star in the left hind-shank lies in the middle of the Milky Way, the star in the same ankle and the star in the right fore-ankle being very nearly 2� north of the southern arc. And the parts arout the hind feet are rather denser. ..." (Almagest, Book VIII, Chapter 2)
Ptolemy's analysis exemplifies the earliest human understanding of the Milky Way � an irregular band of light of unknown nature � that persisted up through the 17th century, when Galileo first resolved parts of the Milky Way into through the late 18th century. In the last decades of the 19th century, before photographic astronomy made visual study of the Milky Way superfluous, the celestial artist �tienne Leopold Trouvelot expressed the esthetic power of this delicate and immense feature: "During clear nights when the Moon is below the horizon, the starry vault is greatly adorned by an immense belt of soft white light, spanning the heavens from one point of the horizon to the opposite point, and girdling the celestial sphere in its delicate folds." (The Trouvelot Astronomical Drawing Manual, 1882) Several "Milky Way skyscapes" depicting its naked eye appearance were made in the 19th century: Otto Boeddicker (observing in Ireland) and John Herschel (in South Africa) completed several fine examples. Trouvelot's portrait combines a Milky Way skyscape with the positions of bright stars and an ocean horizon (image, right), and is centered on the divided area from Cygnus to Sagittarius described by Ptolemy. Aside from their historical importance, these drawings are all touched by the visual beauty of the Milky Way, and underscore the importance of beauty in motivating the difficult work of observational astronomy. Probably the last major Milky Way skyscape was the Lund panorama (image, below), a 2 meter long painting completed in 1955 and currently held at the Lund Observatory, Sweden. Unlike the many 19th century renderings based on naked eye observations, this painting relied on detailed isophote charts compiled from photometric surveys by Anton Pannekoek and colleagues in 1949.
The Lund panorama stands for the naked eye phenomenon that we must explain as a physical feature. The path to greater understanding progressed in three giant steps, relying first on the telescope, then on long exposure astrophotography, and finally on radio astronomy. The Telescopic Era. In 1610 Galileo's Siderius Nuncius announced four dramatic telescopic discoveries: the cratered and mountainous surface of the Moon, the four revolving moons of Jupiter, the resolution of nebulae into clusters of stars, and the discovery of many new stars in the Milky Way too faint to be seen by the naked eye: "For the Milky Way is nothing else than a congeries of innumerable stars distributed in clusters. To whatever region of it you direct your spyglass, ... the multitude of small stars is truly unfathomable." This was the first indication that the universe was not identical to the apparent dome of the night sky but contained far more objects, and possibly extended to a greater distance, than the naked eye could see.
Much later, toward the end of the 18th century, William Herschel manufactured telescopes of sufficient aperture and optical quality to compile 698 "star gauges" or methodical counts of the number of stars within a standard telescopic field of view in different parts of the sky. Assuming that stars were approximately equally bright and evenly distributed in space, so that a greater density implied a longer view through the cloud, Herschel was able to deduce the Sun's position near the center of an extended mass of stars (On the Construction of the Heavens, 1785). He summarized his findings in a diagram (above left) representing the Galaxy in a cross section extending from the divided band in Cygnus on the left to Puppis on the right; the Sun is located slightly to the right of center. This is the first empirical conception of the Galaxy: "a very extensive, branching, compound Congeries of many millions of stars." Herschel estimated his telescopic "sounding line" could measure out to "not less than 497 times the distance of Sirius from the sun" (1300 parsecs in modern units), and because he found no stars beyond roughly 100 times the distance to Sirius in the direction of the galactic poles, he concluded that empty space lay beyond and therefore we inhabited a "detached nebula" similar to the nebulae widely separated in space that Herschel was cataloguing at the time. This star count approach was adopted and greatly refined by Jacobus Kapteyn (1922). Using photographic star counts and kinematic analysis based on measures of parallax and proper motion in 206 "Selected Areas" of the sky, Kapteyn placed the Sun about 650 parsecs from the center of a disk shaped conglomeration of 47 billion stars having an estimated radius of 8500 parsecs and a center of rotation in Cygnus.
In contrast to the Herschel/Kapteyn approach, which assumed an approximately uniform distribution of stars, others attempted to explain the visible lack of uniformity in the Milky Way � the clumpy variations in brightness, clearly outlined dark areas, and streams or bands of faint stars, as memorably described by John Herschel (1847): "The Milky Way is like sand, not strewed evenly as with a sieve, but as if flung down by handfuls (and both hands at once), leaving dark intervals, and all consisting of stars ... down to nebulosity in a most astonishing manner." The Photographic Era. The advances in long exposure astrophotography due to the work of Andrew Ainslie Common (1883), Isaac Roberts (1899), James Keeler (1908) and E.E. Barnard (1913) produced views of nebulae, the Milky Way and other galaxies in a level of detail and consistency of magnitude estimation not possible with the naked eye at any practicable aperture. Richard Proctor (1869) suggested that the Milky Way was composed of "a distinct ring of matter out younder in space, [which] is of nearly circular section throughout its length." But the Dutch astronomer Cornelis Easton (1900) argued that this annular hypothesis was incompatible with available evidence. Adapting a photograph by Roberts of the spiral M 74 galaxy, he proposed that the Galaxy was a spiral nebula and the annular appearance was actually composed of spiral arms. He associated an inner "ring" with "'the belt of bright stars' of John Herschel and Gould" (the Gould belt), which was inclined 20� to an outer ring of distant stars that comprised what we could see of the farther Galaxy, whose center of rotation he located in the Cygnus star cloud between β and γ Cygni at some distance from the Sun (diagram, right). Confusion about the actual dimensions and nature of the Galaxy appear as late as the "Great Debate" between Harlow Shapley and Herber Curtis in April, 1920. This event was held at a time when information about many aspects of the Milky Way (globular clusters, H II regions, stellar magnitudes and proper motions) was rapidly increasing. For example, Shapley (1918) had recently used the photographically measured period/luminosity relation of RR Lyrae variable stars found in globular clusters to estimate the distance of these clusters; their three dimensional distribution suggested the center of the Galaxy was in the direction of the constellation Scorpius at a distance of between 13,000 to 20,000 parsecs. In the debate, divergent conclusions were drawn as to the validity or interpretation of the limited information then known about the Galaxy. Shapley argued that the Sun was eccentrically placed in an enormous (~90,000 parsec diameter) "island universe", surrounded by nearby spiral objects that were most likely to be much smaller gaseous nebulae; he suggested other galaxies similar to ours might exist but were too far away to detect. Curtis replied that the Sun was centrally placed in a small (less than ~9,000 parsec diameter) galaxy surrounded by other similar galaxies at distances of 3 million parsecs or more; he suggested these distant nebulae were only visible near the poles of the Milky Way due to obscuring matter within the disk. Remarkably, the two scientists were both right and wrong in about equal measure. These basic uncertainties were resolved by Edwin Hubble (1929), who obtained a series of photographs of the Andromeda and Triangulum galaxies (M31 and M33) that were sufficiently detailed to identify individual Cepheid variables within them, then used the Cepheid period/luminosity relationship to deduce distances to these galaxies of about 275,000 and 263,000 parsecs, respectively (about one third of current estimates). The same year, using spectrophotography to measure the radial velocity of many nearby galaxies, Hubble published his first demonstration of a "velocity-distance relation among extra-galactic nebulae" � the red shift that has since been used to estimate cosmological distances exceeding several billion parsecs. In the same decade, large scale proper motion and radial velocity surveys of individual stars within the Galaxy provided data that allowed Bertil Lindblad (1927) to outline the spiral kinematics of the Galaxy and the formation of spiral arms, and Jan Oort (1927) to estimate the rotational velocity of the Sun and to locate the center of the Galaxy in the direction of the constellation Sagittarius at a distance of approximately 6300 parsecs (which he later revised to ~9000 parsecs, only 8% greater than the current value). Thus, by 1930 the "disk" structure, rotational speed, center of rotation, and dimensions of the Galaxy, and the relative size and distances of the galaxies around it, had been established. The Wide Spectrum Era. Astrophotography extended the reach of observation to galaxies distant from our own, but it could not penetrate far within our own Galaxy due to the obscuring clouds of gas and dust hypothesized by Curtis. The presence of this obscuring matter was verified by Robert Trumpler (1930), who showed that the diameter of open star clusters diminished with distance less rapidly than the brightness of the stars inside them. This interstellar medium of gas and dust, confined to within a few hundred parsecs of the galactic plane, obscures (reduces) stellar brightnesses by about 0.7 magnitudes per kiloparsec of distance from the Sun, mostly in "blue" wavelengths, which produces a corresponding reddening in the photographic color of stars. In the extreme, this obscuration becomes an interstellar extinction that blocks visual examination of the total extent of the Galaxy. Later, Walter Baade (1951) demonstrated that dark clouds and star forming regions in the Andromeda galaxy were confined to the visible spiral arms.
Following that lead, the spiral structure of the Galaxy was first detected by Morgan et al. (1953) who applied the method of spectroscopic parallax to determine the distance of 27 OB associations, H II regions and K giant stars. These appeared to identify segments of three spiral arms closest to the Sun, although the method could not trace the spiral arms to any great distance. Becker & Fenkart (1970) and others augmented Morgan's method with larger and more accurate samples of young open star clusters and H II regions. A more powerful method followed the conjecture by Hendrick van den Hulst (1949) that the 21 cm emission line of atomic hydrogen (H I) could be used to make observations in radio wavelengths that would easily pass through obscuring gas and dust. During the 1950's, Oort, Kerr & Westerhout (1958), along with many collaborators worldwide, used radio telescopes in Europe and Australia to trace the position and radial velocity of hydrogen clouds within the Milky Way, then applied Oort's kinematic analysis to plot the velocity data as a spiral structure � the first reasonably accurate image of the structure of most of the Galaxy (diagram, left). During the 1960's these 21 cm line radio surveys were extended to greater coverage and resolution (cf. Westerhout & Wendlandt, 1982), as reported in the 1970 IAU symposium The Spiral Structure of Our Galaxy (cf. Bok, 1970). These early studies tend to identify four spiral arms: a "very conspicuous" Perseus arm, a "quite poorly defined" Orion arm (the Local Arm), a "well defined" Sagittarius arm, and a Norma arm [now called the Scutum-Crux arm] beyond and clearly separated from the Sagittarius arm (Court�s & alia, 1969). Later surveys used carbon monoxide (CO) emissions as a radio marker for otherwise invisible molecular hydrogen (H II; Dame & alia, 1987).
Subsequent studies improved on these results by combining spectroscopic parallax with radio astronomy to improve the estimated distances to the star forming regions and young star clusters that were presumed to be tracers of spiral arm structure. Typical of work at this time is the detailed map of the local region of the Galaxy and a large arc of the Sagittarius-Carina spiral arm by Roberta Humphreys (1976). She combined data on supergiant stars, OB associations, galactic star clusters, H II regions and stellar proper motions, and concluded that our Galaxy had two prominent spiral arms and, in overall structure, most resembled an Sc or "M 101 type" spiral galaxy such as NGC 1232 (also cited as an exemplar by Becker & Fenkart.) Finally, Georgelin & Georgelin (1976) combined a meticulously measured and validated sample of more distant H II regions with radio observations of spiral arm velocity tangents and compact radio sources to create a widely cited and remarkably robust model of the Galaxy with four prominent spiral arms (diagram, right). This model placed the Sun (S) 10 kiloparsecs from the galactic center (GC), located it between the Sagittarius (no. 1) and Perseus (no. 2') spiral arms, and demoted the Orion "arm" to the status of a spur or branch between them; renamed no. 2 the Scutum-Crux arm, and identified a new arm (no. 1'), named the Norma arm, closest to the galactic center. The two pairs of arms 1/1' and 2/2' are symmetrically opposite each other and curve outward in identical spiral slopes. Four decades later, only the solar radius is known to be significantly in error. In all other respects, our current consensus model of the Galaxy is nearly identical to this late 20th century "draft" of the Galaxy structure. Astronomical MethodsFour Forms of Measurement. The fundamental attributes in astronomy include position, time, distance, dimension, mass, energy, temperature, spectral radiance profile, magnetic flux, chemical composition, structure, motion and age. These are related to each other in ways that often allow one attribute to be inferred from the others. Remarkably, these variables are studied using four principal methods: celestial position, physical appearance, spectral analysis, and computational prediction or simulation. Celestial Position. The earliest steps in astronomy, developed in Middle Eastern civilizations, attempted to the determine the positions of the Sun, planets and stars on the celestial sphere and predict lunar and solar eclipses. Positional measurement allowed the basic distinction between the "fixed" stars and the rapidly moving bodies of the Solar system. Ptolemy's Almagest epitomizes this tradition by recording the positions (to within 10 arcminutes) of approximately 1000 naked eye stars and calculating basic orbital parameters for the known planets. Lunar and planetary orbits were measured with increasing precision up through the work of Tycho Brahe in the 16th century, and Brahe's measurements of the orbit of Mars allowed Johannes Kepler to infer his three "laws" of orbital dynamics, which Isaac Newton generalized to elliptical orbits of any eccentricity in his Principia mathematica. Further advances required several innovations: optical instruments to measure stellar altitude and azimuth at the arcsecond level, accurate clocks to measure the time of transit to within a second, a fixed celestial coordinate scheme, and the tools of spherical geometry and trigonometry necessary to determine relative distances and planetary orbits on the celestial sphere. Eighteenth century visual measurements of absolute celestial position were made using a transit telescope and an accurate sidereal clock, while measures of the relative position of binary stars were made in the 19th century with an eyepiece filar micrometeter. Astrometry � the measurement of celestial position at a specific time � laid the foundation for celestial catalogs, star atlases, calculation of gravitational dynamics, and the refined forecasting of planetary positions, lunar and solar eclipses and lunar occultations. Astrometric surveys were extended to the southern hemisphere in the 19th century, and star catalogs incorporated fainter stars by means of larger transit instruments. By measuring at opposite times of the year the relative position between nearby and distant stars that were visually close together, astronomers could calculate spatial distance using geometric parallax, identify proper motion as changes in photographic positions, and calculate the orbital parameters of a small number of binary stars. These binary measurements gave the first indications of interstellar distances, galactic motion, and stellar dynamics � ultimately the key to the calculation of relative stellar masses. Positional data and changes in position over time are so critical in astronomy that they are now collected by astrometric satellites and ground based telescopes that provide an unparalleled precision and reliability of measurement. By the year 2020 the Gaia satellite will extend the horizon of positional and dynamic astrometry almost to the galactic center. Coordinate Systems. Coordinate systems provide a way to systematically record celestial position and to compare positional measures of motion across time. The earliest system of mesurating the sky was based on the twelve constellations of the zodiac, comprising the celestial paths of the Sun, Moon and six naked eye planets. A complete solar cycle around the Zodiac determined the time interval of the year; the twelve "houses" (constellations) of the Zodiac divided the year into 12 months. The path of the Sun across the sky is the ecliptic, which defines a great circle on the celestial sphere. A great circle is defined by a plane that passes through the center of a sphere, so the ecliptic is defined on the celestial sphere by a plane that passes through the center of the Earth and contains the Sun's apparent orbit around the Earth. It is also, within a few degrees inclination, the average path in the sky traced by the Moon and planets (excepting Mercury). The ecliptic is chiefly used as an astronomical coordinate system for calculating the position of solar system bodies such as comets and asteroids. For objects outside the solar system, the equatorial (celestial) coordinate system takes the Earth's equator as the fundamental plane and the projection of the Earth's axis of rotation as the celestial north and south poles. Location around the celestial equator is measured as right ascension (RA or α) in units of time (hours, minutes and seconds; one hour of RA is equal to 15�), starting at the vernal equinox and increasing from west to east. The distance from the celestial equator to a celestial pole is measured in degrees of declination (Dec or δ), with a minus sign indicating measurement toward the celestial south pole. The Earth's axis of rotation is not fixed in relation to the stars but appears to move in a precession circle caused by the long period (~26,000 year) wobble in the Earth's axis of rotation. This wobble performs a circle around the pole of the ecliptic and the radius of the precession circle is about 23.5�. This causes the location of celestial north to change and the vernal (March) and autumnal (September) equinoxes to progress through all the constellations of the Zodiac. Due to precession, the fixed celestial coordinate system periodically must be shifted so that the coordinate celestial poles are consistent with the dynamic poles. For most astronomical atlases and references this epoch is revised every twenty-five or fifty years (the current epoch is J2000), but in astrometry the epoch is often recorded in fractions of a day. William Herschel (1785) first recognized the importance of a galactic coordinate system, but developing the system was thwarted by a lack of clarity about the Galaxy itself. In 1958 the International Astronomical Union (IAU) established the system currently in use (Blaauw et al., 1960). Galactic coordinates are stated in degrees of latitude (b) and longitude (l), with longitude increasing from west to east. The galactic fundamental plane was defined by radio telescope measurements of the remarkably flat (~50 parsec thick) disk of galactic neutral hydrogen within 60� on either side of the galactic center, which placed the north galactic pole (NGP) in the constellation Coma Berenices. The origin of galactic longitude (0�), in earlier times placed in Cygnus or Aquila, was centered on the complex radio source Sagittarius A* (spoken as Sagittarius A star), which was later identified as a super massive black hole at the barycenter of the Galaxy and the best physical marker of the galactic barycenter. (The SMBH itself is located about 4 arcminutes from the radio marker used in the 1958 system.) The figure (below) shows the locations of the ecliptic north pole (NEP) in the constellation Draco (located almost exactly at the Cat's Eye Nebula, NGC 6543), the celestial north pole (NCP) in the constellation Ursa Minor, ecliptic and celestial equator in relation to the galactic north pole (NGP) and cardinal points of galactic longitude.
Only galactic coordinates are used on this page to locate objects. Note that the precession of the celestial pole will appear to move counterclockwise around the NEP from the vantage of "observer". Note also that the distance of the Sun above the galactic fundamental plane (Z⊙) is about 23 parsecs (the average of 22 separate estimates). This causes objects relatively near the Sun that actually lie in the fundamental plane to appear below the galactic equator. A galactic rectilinear system of three Cartesian coordinates, denoted x, y and z, can be constructed to represent the galactic coordinate system axes as linear distances. The x dimension extends from the Sun through the galactic barycenter (galactic coordinates l = 0�, b = 0�); z is a dimension from the Sun through the galactic north pole (b = 90�), and y is the dimension perpendicular to both x and z in the direction of the galactic rotation (l = 90�, b = 0�). All dimensions are usually measured in parsecs. The xy plane conveniently divides the galactic disk into four quadrants, labeled in counterclockwise order (see figure).
the UVW rectilinear coordinate system The UVW system, fundamental for the study of Galaxy kinematics, is a vector coordinate system of stellar velocities relative to the local standard of rest (LSR), an imaginary point in a circular orbit in the Galaxy fundamental plane and comoving with the average rotational speed of stars at the same distance as the Sun from the galactic center; UVW values are normally expressed in kilometers per second. Only the positive directions of the UVW dimensions are shown in the figure. Note that neither the xyz nor UVW systems are projected onto the celestial sphere. The xyz system is a true spatial frame of reference: a Euclidean distance calculated from xyz values is the real distance from the Sun. As a vector system, the UVW coordinates have no center: an object with zero values of U, V and W is moving in exactly the same direction at the same speed as the LSR, but can be located at any distance in any direction from the Sun. Physical Appearance. Before the turn of the 20th century, astronomical research methods were exclusively visual: humans looked into the sky with various instruments and documented what they saw. Even after astrophotography became the principal research tool for astrometry and deep space astronomy, visual study remained the primary tool in lunar and planetary astronomy up to the satellite era and the probes launched to the Moon from 1964 (Ranger 7) and to the planets from 1969 (Mariner 6 & 7): but a principal measurement delivered by these probes was video imagery. The invention of the telescope revealed that: the Sun and planets were solid bodies rotating in fixed periods; they differed in dimension and surface appearance; they had satellites; the Sun had changing spots and Saturn had enduring rings. Deep space objects were cataloged for the first time, nebulae distinguished in size and form, and the structure of the Milky Way probed with "star gauges" or star counts. Visual cartography focused on Mars and the Moon. In the second half of the 19th century, astrophotography produced more accurate positional information on stars of fainter magnitudes and allowed for the first time the definitive categorization of visual "faint fuzzies" as planetary nebulae or emission nebulae and globular clusters from very distant spiral and elliptical galaxies, and provided large scale surveys of the Milky Way, including the first clear portraits of galactic interstellar medium. Despite the enormous advances in instrumentation and the extension of imagery to wavelengths and flux levels invisible to the human eye, the importance of "appearance astronomy" is evident in the many features first identified or primarily studied through their visual structure or visual evidence of change: binary stars, variable stars, planetary nebulae, open star clusters, Bok gobules, Herbig-Haro jets, novae, pulsars, quasars, star forming regions, galaxy Hubble types, galaxy clusters, the earliest galaxies, the cosmic microwave background. The achievements of the Hubble and other space telescopes have been principally in high quality imagery of nearly every type of astronomical object; the value of high quality imagery motivates the optimal siting of new terrestrial observatories, the use of adaptive optics and speckle interferometry, computer image processing, and the imagery from planetary survey vehicles in the Voyager, Mariner, Cassini and Mars Explorer programs. To a remarkable degree, astronomy remains a visual (optical) science. Spectral Analysis. The previous two methods, celestial position and physical appearance, developed using the eye and photographic emulsions as the two principal detectors. These sum within the image all the visual radiation (roughly 800 to 400 nanometers) from the celestial object. This method is epitomized as the brightness or magnitude of celestial objects, originally based on the visual comparison of stars but standardized as various forms of photometry.
identical sections of the Milky Way imaged using four bandwidths: (1) 2.4 to 2.7 gigaHertz radio waves; (2) 1 micron imaging of 12CO emission associated with molecular hydrogen; (3) H-alpha; (4) far infrared At first, the advent of photography allowed magnitude to be more accurately measured as the size (density) of the photographic star image, which extended catalogs of stellar position and magnitude far below the naked eye limit. But around the turn of the 20th century it became possible to decompose the visual radiation into its constituent spectrum, and photography was used to record the spectral profile of stars as the location and intensity of specific spectral absorption or emission lines imaged through a prism or reflected from a diffraction grating. These early spectrum images laid the foundation for the large scale spectral classification of stars, published as the Henry Draper Catalog (1890). The original (and still most accurate) method relies on the detailed visual inspection of a diagnostic part of the spectrum; later the spectral type was inferred from the color index or relative magnitude (intensity of radiation) in two photographic plates imaged in short versus long wavelengths by means of two different colored filters. In addition to the classification of stellar types, spectral decomposition allowed two other important insights. First, spectral lines are produced by light emitted from specific atomic elements, and these lines (as identified in terrestrial laboratories) were used to determine the chemical composition of the Sun, planets, stars and nebulae. In stars, chemistry is summarized as metallicity or the log ratio between the spectral presence of hydrogen or helium and some heavier element such as iron; metallicity tracks the sequence of star formation in cosmological time and can tag "star streams" in the Galaxy of common origin. The spectral analysis of emission nebulae and galaxies verified that these were composed primarily of hydrogen and helium and allowed more precise estimation of their temperatures; it also indicated the stellar composition of other galaxies. Second, spectral lines are shifted in position by motion toward or away from Earth, and these Doppler shifts allowed measurement of radial motion which, in combination with proper motion, allowed a complete kinematic analysis of galactic structure and rotation. The variation of Doppler shifts and light curves in eclipsing binary stars allowed the association of spectral and luminosity types with characteristic stellar radii and provided the critical missing piece that, combined with astrometric measurements of proper motion or change in celestial position across time, allowed the three dimensional spatial analysis necessary to fully specify the dynamics of binary star orbits and the galactic orbits of individual stars. Radial velocity by itself revealed the recession of galaxies (the cosmological red shift) and the large scale expansion of the universe. Combined with parallax or geometric distance estimates, the absolute magnitude (intrinsic brightness) of different spectral types could be estimated; combined with binary star dynamics the relative masses of spectral types could be derived. Around 1900 the link between a stars spectral profile and the blackbody temperature of its photosphere allowed the temperature of stars to be inferred from the spectral "color". This unlocked the relationships between mass, luminosity, effective temperature and spectral type at the heart of the Hertzsprung-Russell mass-luminosity diagram, and the eventual development of theories of nuclear fusion, nucleosynthesis, stellar evolution and star formation. Accurate time series measures of magnitude allowed for a precise analysis and classification of variable stars, including the RR Lyrae and Delta Cephei variables whose temporal periods are closely linked to their intrinsic brightness. These relationships, discovered in early 20th century, allowed the brightness distance relationship to be extended from stars whose distances could be measured by parallax to distances estimated by the apparent brightness of these "standard candle" variable stars. These permitted the first distance estimates to globular clusters and nearby galaxies, establishing the scale of the solar radius and intergalactic space. Finally, advances in aperture, instrumentation and detectors expanded spectral decomposition to include the entirely new bandwidth sections of the electromagnetic spectrum. Xray, infrared and microwave telescopes in particular capture radiation that is very little obscured by interstellar dust and gas, resulting in a much expanded view in space and a more penetrating view into densely obscured areas of star formation. Microwave and infrared surveys, including long baseline arrays, have established the kinematics of large star forming regions several kiloparsecs away, which have been used to trace the spiral arms of the Galaxy. Computational Astronomy. During the latter half of the 20th century the computer became an essential astronomical research tool. Computers made it possible for the first time to assemble, compile and verify the enormous quantities of data from astrometric satellites, to exploit the potential of active and adaptive optics to overcome the deterioration of astronomical imaging due to atmospheric turbulence, and to develop numerical simulations of long term cosmological and galactic processes. Computers have allowed the aggregation of astronomical catalogs at a scale well beyond anything possible by human hands in the previous era. The Tycho catalog lists the positions of roughly 2.5 million stars, and the forthcoming Gaia catalog will extend measurement to as many as 1 billion objects. Large baseline array interferometry is only possible through the digital interconnections among widely separated instruments, and computers are used to stack, process, filter and sharpen astronomical imagery, control and communicate with deep space probes, and reliably classify the spectra of hundreds of thousands of stars and galaxies. This last resource � computer simulation � has provided some of the most basic insights into nucleosynthesis, stellar nuclear dynamics, star formation, gravitational dynamics, stellar collapse and supernova events, star cluster evolution, galactic dynamics and cosmology. Much of what we believe we know about astrophysics is the product of known physical laws applied by calculation or simulation to the known mass, temperature, density, dimension and dynamics of astronomical objects. The fundamental power of the method is that it transcends our extraordinarily limited sample of astronomical time and allows study of processes that may span millions or even billions of years. It is hardly an exaggeration to say that high speed computers and computationally efficient simulation software represent the largest aperture astronomical instrument in use today. Computers can pierce the veil of time, which is far more opaque than the cloaks of distance and magnitude or the landslide mass of astronomical data. Measurement Units. [DRAFT] For reference, this section defines the principal units of measurement used by professional astronomers; some of these are not among the International System of Units. Distance. The METER (m) or KILOMETER (km) of 1000 meters is the standard unit of small dimensions (up to the diameter of planets or stars), equal to the distance in a vacuum that a photon travels in 3.336�10�9 seconds. The ASTRONOMICAL UNIT (AU) is a relative unit of astronomical distance, equal to the average radius of the Earth's orbit around the Sun or 149,597,871 (1.496�108) kilometers; it is usually applied to dimensions on the scale of planetary or binary star orbits. The PARSEC (pc) or KILOPARSEC (kpc) of 1000 parsecs is the standard astronomical unit of large dimensions, defined as the distance at which a spatial interval of 1 AU will subtend an angular interval of one arcsecond (") � that is, a width of 1 AU viewed from a distance of 30,856,804,799,936 (3.086�1013) kilometers. By definition, one parsec is equal to 206,285 AUs, the number of arcseconds in a radian. The parsec unifies astronomical distances across many scales. Thus, 0.1 parsec is roughly the maximum orbital radius between gravitationally bound stars, 1 parsec is the average distance between single stars in the Galaxy, 10 parsecs is the benchmark distance for the calculation of absolute magnitude, 100 parsecs is the diameter of a large globular cluster, 1000 parsecs (1 kiloparsec) is the width of a galaxy spiral arm, 10,000 parsecs (10 kiloparsecs) is the radius of an average spiral Galaxy, 100,000 parsecs is the outer orbital limit between parent and satellite galaxies, and 1,000,000 parsecs (1 megaparsec) is the average distance between galaxies in the Universe. The antiquated light year, used primarily during the late 19th to mid 20th centuries, is now encountered in the lay literature of amateur astronomy, science fiction and science journalism. As simple conversions: 1 parsec = 3.26 light years, and 100 light years = 31 parsecs. Mass. The GRAM (g) or KILOGRAM (kg) of 1000 grams is the standard unit of mass, roughly 2.2 US pounds; the Solar mass (M⊙) is the unit of relative mass, equivalent to 1.989x1030 kilograms. The mass range of stars that fuse hydrogen or heavier elements is roughly 1.392�1029 kg (0.08 M⊙, the hydrogen burning limit) to about 2.983�1032 kg (150 M⊙). Time. The SECOND (s) is the standard unit of time, formerly defined as a small interval of a standard day but now defined as the interval required for 9.19�109 hyperfine electron transitions in a cesium atom; the relative units of time are the DAY (d) equal to 84,600 seconds and the YEAR (yr) equal to 31,557,600 seconds (3.156�107 s). The megayear (Myr) is one million years or 3.156x10¹³ s. The age of the Earth is roughly 1.433�1017 s (4.54 billion years), and the age of the universe is roughly 4.354�1017 s (13.8 billion years). Energy. The NEWTON (N) is the standard unit of gravitational force or acceleration, equal to the energy necessary to accelerate 1 kg of mass at the rate of 1 meter per second squared (notated 1 kg m/s2 or 1 kg m�1 s�2). The gravitational acceleration (G) acting on 1 kilogram at the Earth's surface is equal to 9.807 N; at the photosphere (surface) of the Sun G = ~274 N. The JOULE (J) is the standard unit of kinetic or mechanical energy, equal to 1 newton; this is equivalent to the energy required to raise a mass of 100 grams a vertical distance of 1 meter at the Earth's surface. The WATT (W) is the standard unit of power (energy per unit time) or of radiant flux (energy per unit time emitted into a unit area), equal to 1 joule per second (power) or 1 joule per second per square meter (flux). The Solar luminosity (L⊙) is the relative unit of radiant flux across the entire electromagnetic spectrum, equal to roughly 3.846�1026 W. Brightness. MAGNITUDE (m) is the log ratio of brightness between the brightness of a celestial object and the brightness of an arbitrary standard object; for stellar magnitudes the arbitrary standard has been the star Vega with a magnitude of 0.03. ABSOLUTE MAGNITUDE (M) is the magnitude of an object at a standard 10 parsec distance; the absolute magnitude of Vega is +0.6. Magnitude is normally measured within a limited spectral range, which must be specified unless the visible spectrum is understood. Note that in astronomy luminosity usually refers to radiance across all wavelengths, not just visible wavelengths. The metric for the brightness of extended objects, such as nebulae or galaxies, is total magnitude or integrated magnitude, the brightness emitted by the entire object equated with the magnitude of a single star. Because the luminance is diffused over the visual extent of the object, the object will appear much fainter than a star of the same magnitude. To avoid this problem, the surface brightness is calculated as the integrated magnitude divided by the surface area of the object, in square arcseconds. Temperature. The KELVIN (K) is the standard unit of temperature; the relative unit of temperature is the DEGREE (Celsius), which is not used in astronomical contexts although its scale units (degrees Centigrade) are identical in magnitude to kelvins. The zero point of the kelvin scale is absolute zero, or the complete absence of all thermal motion: this is a theoretical definition, since (according to the Third Law of Thermodynamics) it is not possible to achieve in physical systems. The temperature of the triple point of water (0� C) is 273 K, the effective temperature of the Sun's photosphere (surface) is roughly 5800 K, and the temperature at the Sun's core is estimated to be roughly 1.57�107 K. Anatomy of the GalaxyThe Galaxy is a turbulent system of many distinct components. Galaxy Structure & Dimensions. [DRAFT] The basic attribute of a galaxy is its galaxy type in the Hubble original or revised (de Vaucouleurs) systems. The Galaxy is currently believed to be a Hubble type Sb (Vaucouleurs type SB(rs)bc II) galaxy, in other words it has a pronounced spiral structure that includes a prominent central bar and a ring structure. Any component of the galaxy has a characteristic thickness, the scale height, and radius measured from the Galaxy barycenter. Since the bulk of Galactic mass is found in dark matter, this acts as a frictionless gravitational medium. The primary consequence is that the Galaxy is an encounterless medium with respect to stars, which are spaced about one parsec apart. differential rotation, "liquid" disk, collisionless medium. The cross section of stellar dimensions to empty space is about 500 trillion to 1, a ratio that is over 3000 times greater than the number of stars in the Galaxy. A physical example can clarify this point. If we define a main sequence star to have a diameter of 1 millimeter (a grain of sand), then the nearest star to the Sun (at 4.37 light years distance) would be a second grain of sand almost 30 kilometers away. At the center of a globular cluster, the spacing would be one grain every cubic kilometer. Recent parallax measurements of water or methane maser sources distant star forming regions with the Very Long Baseline Array (a group of large radio telescopes interconnected from Hawaii to the Virgin Islands with an angular resolution in the infrared of less than one millionth of an arcsecond) put the Sun at about 8300 parsecs from the Galactic barycenter. Using plate scales and best estimates of distance, we can project the radius of the Solar orbit onto other, familiar spiral galaxies (images, below). This illustrates the astonishing grandeur of both the Galaxy and the Andromeda system.
Place cursor over image to remove labels. The table (below) summarizes the physical parameters of the distinct parts of the Galaxy.
Metallicity is a measure of the proportion of higher elements to hydrogen: hydrogen is the primal cosmic element, while iron is the exclusive product of supernovae. A negative metallicity is a "metal poor" star, associated with increased stellar age. The scale height (H) is the distance within which the density of a feature decreases a factor of 1/e (to ~37%). If the density gradient is approximately Gaussian, the scale height comprises ~63% of the feature mass. We can compare the size of the Galaxy to other galaxies by projecting the solar radius of 8300 parsecs onto their image, given the current best estimates of their distance and their angular size as seen from Earth (diagram, below). This shows that the Galaxy exceeds or rivals the size of the commonly reproduced galaxies in the Messier catalog, and is only slightly smaller than the Andromeda galaxy, our companion galaxy in the Local Group. Although not the largest galaxy we know of, the Galaxy is one of the larger and more massive galaxies in the catalog.
Galaxy Components. [DRAFT] The current consensus is that the Galaxy and the Andromeda galaxy are of similar mass; several lines of evidence suggest the Andromeda galaxy is larger, and appears to have a more massive stellar halo. The consensus mass of the Galaxy is around 1.2x10¹²M⊙ (1.2 trillion solar masses), of which roughly 120 billion solar masses comprise the "bright matter" components of stars, gas and dust, and their energies. However, a recent study by Watkins, Evans & An (2010) estimates the mass of the Galaxy within a radius of 300,000 parsecs to be about 900 billion M⊙, and the mass of the Andromeda galaxy to the same radius to be about 1.4 trillion M⊙.
Interstellar Gas & Dust. [DRAFT] The radiation emitted by a spiral galaxy is the sum of all radiating bodies within it. Star Forming Regions. [DRAFT] The major features are identified in the image (below), with bubble icons or color panels to represent spatial distance. Visually we cannot see far beyond spiral arm tangents or inside them, but radio, infrared and xray astronomy can penetrate them. Single, Binary & Multiple Stars. [DRAFT] The radiation emitted by a spiral galaxy is the sum of all radiating bodies within it. The number of stars per square degree of sky as bright or brighter than magnitude m (Nm) is roughly: [1] Log(Nm) = �0.0003m3+0.0019m2+0.484m�3.82 which is valid over the magnitude range 4.0<m<25.0; the total number of stars is equal to Nm times 41,253, the number of square degrees in the sky.
Available evidence strongly suggests that binary or multiple systems of gravitationally bound stars are created during star formation from the collapse of a single natal cloud core. Dynamic evolution disrupts orbits within the cloud core, inside the natal cluster, and by unstable three body or multiple body interactions within isolated double stars. The result, as measured in solar type stars within 25 parsecs of the Sun, seems to be that roughly 60% of star systems are single (excluding substellar or planetary components from consideration) and 40% of star systems have multiple stellar components. Among these, roughly 70% are binary.
These proportions are only approximate, as mass affects both the multiplicity ratio and the lifetime of the stellar system. Nearly 100% of rare, short lived, high mass (O and B type) stars are believed to have at least one companion star, while the common, very long lived and low mass (smaller K and M type) stars are believed to have a multiplicity ratio below 30%.
Click on the image for the full sized, labeled version (2100x1100 pixels, 283Kb) The chart (above) shows the distribution of "high probability" physical double and multiple stars of apparent magnitude 11 or brighter. The relative profusion and even distribution of the systems is evident of thorough mixing by galactic turbulence and revolution: the concentration toward the galactic plane is nearly effaced. Galactic Star Clusters. [DRAFT] These are loose but persistent agglomerations of stars. Just over 3000 galactic clusters, most of them within 4000 parsecs of the sun, are listed in the Catalog of Milky Way Star Clusters (2013) compiled by Kharachenko, Piskunov, Schilbach, R�ser & Scholz. The chart (below) shows these clusters in galactic coordinates and binned by distance, and displays the strong clustering along the galactic plane and the small number of clusters located nearer than 500 parsecs.
Click on the image for the full sized, labeled version (1824x944 pixels, 76Kb) An analysis of the clusters by age (in log years) and number of cluster members is shown below. Clusters that are also NGC or IC objects are flagged with a red diamond.
The clusters concentrate around an age of about 600 million years with fewer than 100 members. The common naked eye and binocular objects (labeled) are all much more populous and somewhat younger than the typical cluster. Globular clusters are bunched at the upper end of the age scale, around Galaxy formation 10 billion or more years ago. Natal clusters, most of them observed with IR (infrared) telescopes and commonly associated with nebulosity, are bunched at the minimum age of 1 million years. Globular Clusters. These are compact, bright, approximately spherical clusters of between 104 to 106 stars, with a half mass radius that is typically less than 5 pc and a central density of more than 100 M⊙/pc3 and an absolute magnitude less than �5. Several of the largest galactic GCs are suspected to contain a medium mass black hole. Most galaxies with masses greater than ~109 M⊙ that we can view with sufficient resolution display dozens or hundreds of globular clusters, often in orbits no larger than the radius of the galaxy itself; the Large and Small Magellanic Clouds have 24 GCs between them. This indicates that GCs are closely related to the origin of the galaxies themselves; GCs are often referred to as "fossils" of galaxy formation processes and are believed to have formed as part of a "primordial" population of stars. The Galaxy counts over 150 globular clusters orbiting around it with periods of 100 million to 700 million years. The current understanding is that these clusters formed in one of three ways: (1) the "in situ" spontaneous collapse of massive clouds during the original formation of the Galaxy; (2) as the nucleus or a globular cluster originally forming in a dwarf galaxy which later accreted to the Galaxy, and (3) as a "starburst" or massive star forming region created by the encounter between an already formed dwarf galaxy and the Galaxy. NGC 1705 is an example of a dwarf galaxy with a dense, globular cluster type nucleus; 30 Doradus (in the Large Magellanic Cloud) is an example of a large star cluster that is forming due to ram pressure from the Galaxy halo. Because they formed in the first one or two billion years of the universe, many globular clusters were originally composed entirely of "primordial" stars of nearly pure hydrogen (very low metallicity). However, as the most massive O, B and A stars in the cluster expired as supergiant stars, novae or rapidly rotating and massive "spinstars", their demise enriched the remaining stars with heavier elements. At present most globular clusters have an integrated "solar" spectral type of F5 through G9, consist of roughly one third primordial stars, and include a small proportion of Type A "blue straggler" stars that apparently result from the merger of close binary stars. Globular clusters represent about 5% of the total mass of the supercluster in which they formed, which would rival the mass of many dwarf galaxies. GCs would represent the mass concentration at the center of the supercluster; the surrounding gas would be pushed away by the radiation from the new stars and this reduction in mass would cause the massive loss of more weaky bound components. It is likely that most of the Population II stars in the Galaxy halo are primordial globular cluster stars lost during accretion into the Galaxy.
The age of a globular cluster is determined by its metallicity and the location of the turnoff branch of its stellar population in an HR diagram. Various studies converge on an age range of 14 to 5 billion years, which divides clusters into two groups: (1) A "primordial" group with a median age of about 12.8 billion years that appears to have formed within a limited period of 800 million years at the time of the Galaxy formation. These clusters tend to have very low metallicity and include M 4, M 12, M 15, M 22, M 30, M 55, M 69, M 80, M 92, M 107 and 47 Tucanae. (2) A group of roughly 25 to 50 clusters formed after Galaxy formation, mostly within 11 to 8 billion years ago that includes M 5, M 72 and M 75. In this group are clusters that originally formed in six to eight dwarf galaxies that were accreted into the Galaxy after its disk formation, including M 54, NGC 2808 and ω Centauri (image, left), clusters believed to be the remnant nuclei of disrupted dwarf galaxies. These are often clusters with retrograde orbits (in the opposite direction of the Galaxy rotation). The chart (below) shows the distribution of the brightest or most massive clusters in relation to the galactic disk in YZ coordinates, and clearly shows the concentration of clusters around the galactic nucleus.
Carretta & alia (2010) relied on the cluster orbital kinematics to identify: (1) a disk/bulge population of 75 clusters (about half of all GCs known), which tend to be very old yet have a relatively high metallicity enriched by stars within the galactic disk, including 47 Tuc, M 9, M 10, M 12, M 19, M 22, M 28, M 55, M 62, M 69, M 70, M 71, M 107, NGC 6388 and NGC 6441; (2) an inner halo group of 33 generally more massive clusters, including ω Centauri, M 2, M 3, M 4, M 5, M 13, M 14, M 15, M 30, M 56, M 68, M 72, M 75, M 80, M 92, NGC 362 and NGC 2808; and (3) an outer halo group of 27 generally smaller and fainter clusters, resembling the clusters observed in nearby dwarf galaxies, including M 53, M 79, Pal 1, NGC 1851, NGC 5824 and NGC 6229. An additional 7 clusters, including M 54, Terzan 7, Pal 2 and Pal 12 appear to be remnant components of the Sagittarius Dwarf galaxy, which is being dismembered by the Galaxy. Satellite Galaxies. In addition to the ubiquitous globular clusters, many galaxies are observed to have satellite galaxies. A Wikipedia list of the Galaxy's satellites currently lists 36 confirmed or candidate satellite galaxies, most of them dwarf spherical or elliptical galaxies.
The largest satellites are the Large Magellanic cloud (image, left), a barred galaxy about 48,500 parsecs from the Sun in the direction of the constellations Dorado and Mensa (l = 280�, b = �33�), and the Small Magellanic cloud, an irregular galaxy 61,000 parsecs away in the constellation Tucana. Both galaxies are naked eye objects in the southern hemisphere. The Large galaxy is the site of the largest star forming region visible in our galactic region, NGC 2070 (also known as 30 Doradus or the Tarantula nebula), along with many other star forming regions and star clusters apparently produced by ram pressure with the Galaxy's halo of matter. The Large Magellanic Cloud is an irregular galaxy approximately 4300 parsecs in diameter, at a distance of about 49,000 parsecs from the Sun.
The Fornax, Leo I, Leo II and Sculptor DGs lie within the same plane (great circle in the sky); additional DGs � Coma, Canes Venatici I and CVn II � are within a few degrees of this plane, which implies they formed together. Infalling Matter. [DRAFT] There is also an unmeasured but large quantity of intergalactic matter falling into the Galaxy gravitational potential. This can be observed in radio or infrared observations of other galaxies, for example M 51 (image right, top). A significant portion of this matter has already coalesced into small galaxies that orbit the parent galaxy. The diagram (right, center) shows the satellite galaxies identified in orbit around the Andromeda galaxy. The Local Group. [DRAFT] In addition to its satellite galaxies, the Galaxy is one of three galaxies in the Local Group, including M 33 and M 31. The Andromeda Galaxy is approaching the Galaxy at about 200 km sec�1, which will produce a spectacular and very disruptive close approach in about 3.8 billion years, followed by a likely merger into a single elliptical galaxy in about 5.5 billion years. Galaxy ProcessesThe fundamental galactic processes are rotation and star formation, with radiation as the major product. The flat disk slowly rotates as a near liquid, producing spiral arms; gas and dust are continually condensing to form stars, enriched by the nova expulsion of heavier elements; matter in stars, dust and gas radiates across the entire electromagnetic spectrum, from radio to xray, and as gravity waves. The study of galaxy rotation is kinematics. In the Galaxy, observations must be made from a moving Earth inside a moving frame of reference, and a combination of careful observation of stellar motions and clever dynamic reasoning is required to clarify the actual state of motion. The importance of a kinematic analysis is that it clarifies the behavior of the entire Galaxy as a gravitational system, yielding important conclusions about its mass and history; and it allows us to estimate the distance of galactic objects that cannot be measured with parallax, yielding an overall picture of the Galaxy's structure and star forming processes Among the key parameters in this problem are: � the solar radius in parsecs (R0) or distance of the Sun from the gravitational center of the Galaxy � the galactic rotational velocity in kilometers per second (Θ0) of the Local Standard of Rest (LSR), assuming a circular orbit � the Sun's peculiar motion or deviation (U⊙, V⊙, W⊙) from the motion of the LSR � the Sun's galactic orbital period calculated by combining the peculiar motion with the LSR rotational velocity � the galactic absolute angular rotational speed in radians per second (Ω0), the time for an object's revolution to traverse an angular segment of the orbital circumference. � the aggregate mass rotation curve for the local orbital velocity (ΘR) at every distance R from the galactic center. The Solar Radius. The size of a galaxy is a critical parameter in the study of galactic dynamics and evolution. In our Galaxy, the physical dimensions are anchored on an estimate of the solar radius (R0), the distance from the Sun to the galactic barycenter. By the 1930's, Shapley and Oort had determined that the solar radius was somewhere between 6300 to 30,000 parsecs. After 1950 the values adopted in research publications have ranged from 7500 to 10,000 parsecs; it has been common for researchers to use more than one estimate to improve the comparability of results across research publications. Recently, however, estimates have improved substantially. Independent researchers, using different observing instruments, datasets and analysis methods, have converged on a narrow range of values: � Gillessen & alia (2009) combined the results from two independent research teams that used adaptive optics � at either the NTT/VLT telescope at LaSilla or the Keck telescopes at Mauna Kea � to track the position and radial velocity of the star S0-2 in close (15.6 year) orbit around SgrA*, the supermassive black hole (SMBH) at the galactic barycenter. Assuming a relativistic Kepler orbit, the radius of the orbit was determined from the period and estimated mass of SgrA*, and the distance to the Earth was calculated from the angular width of this orbital radius: their result is R0 = 8280 �290 parsecs. � Sch�nrich (2012) selected from the Sloan Digital Sky Survey a sample of ~50,000 stars within 3600 parsecs and at high galactic latitudes (thick disk and halo stars that do not rotate with the galactic disk). He then used the radial streaming and proper motions of these stars, in combination with the proper motion of SgrA*, to estimate several basic kinematic parameters including the solar radius, which he finds to be R0 = 8270 �290 parsecs. � Do & alia (2013) used adaptive optics imaging and spectroscopy at the Keck telescopes to resolve in three dimensions the structure of the star cluster within 0.5 parsecs of SgrA*, then use the measured radial velocity and proper motion of 10 stars within that cluster to calculate the cluster spatial density profile, cluster velocity profile, SMBH mass, and distance to the galactic center. The cluster analysis by itself yields a solar radius of 8920 �560 parsecs, but combined with orbital data for S0-2, they find R0 = 8460 �400 parsecs. � Reid & alia (2014) used very long baseline interferometry (VBLI) from the BeSSeL Survey and the Japanese VERA program to measure the position, radial velocity and trigonometric parallax of over 100 pointlike maser sources within high mass star forming regions in Quadrants I and II of the Galaxy, then use different assumptions about the rotational profile of the Galaxy to estimate the solar radius and orbital velocity. Their best fitting model yields an estimate of R0 = 8340 �160 parsecs. The average of these four estimates is 8338 parsecs, and the value of R0 currently accepted by the International Astronomical Union is 8500 parsecs � only 2% larger and within the error bounds of all four studies. I adopt the value R0 = 8340 parsecs as the most robust (closest to the average of all studies, with the smallest error bounds) consensus distance, but any study that uses the IAU value of 8500 is within the measurement error of the current best estimates. Differential Rotation. The visible mass of the galactic disk predominantly consists of stars mixed with interstellar gas and dust, all traveling in nearly circular orbits around the galactic center within a very narrow plane or thin disk. The halo Population II stars travel in slower and randomly distributed orbits, giving this population a roughly spherical shape that does not rotate; bulge stars also revolve in randomly distributed circular orbits that combine in their orbital trajectories to produce the central bar. In order to analyze galactic orbits, we define the Local Standard of Rest (LSR) as a point revolving the galactic center in a circular orbit within the galactic disk. The constant (circular) orbital speed of the LSR will depend in part on its distance R from the galactic barycenter. Stars inside the LSR will have smaller circular orbits, stars outside it will have larger orbits. How would stars in these orbits appear from the LSR to move across the celestial sphere? If the Galaxy rotated as a rigid disk, then stars farther from the galactic center to rotate at greater speed because, at a larger circumference, they would have farther to travel in a single rotation; the relative position of the stars would remain fixed in the sky. If the Galaxy rotated as a "fluid disk", so that the velocities of stars remain nearly equal or even decrease with increasing orbital radius, the relative position of the stars would shear: stars outside the LSR would appear to lag behind (they have farther to travel at the same or slower speed), while stars inside the LSR would appear to run ahead (diagram, below left).
From the relative frame of reference at the Sun at the LSR, differential rotation would produce a complex pattern both in the actual stellar radial velocities (physical motion toward or away from the Sun), and in the apparent stellar proper motions (angular motion projected onto the celestial sphere; diagram above right). Near the galactic plane, stars in Quadrants I and III will have a positive radial velocity and appear to recede from the Sun, while stars in Quadrants II and IV will have a negative radial velocity and appear to approach the Sun (yellow lines). The greatest radial velocities will appear at approximately 45� angles to the solar radius and radial velocity will disappear along the solar radius and along the solar orbit. In contrast, the greatest proper motions will appear along the solar radius, will disappear along the Sun's orbit, and will appear to rotate in the same direction along the celestial equator, for example counterclockwise when viewed from the galactic north pole (green arrows). The contrasting effect of disk rotation is vorticity. Viewed from an absolute reference frame (outside the Galaxy and motionless in relation to it), the disk rotation causes objects in different orbits to reverse their positions or appear to "rotate" in relation to each other (diagram, above). In a rigid rotation without shear, the angular momentum contained in this "circular orbit", as observed from the absolute reference frame, is equal to the difference in angular momentum between the inner and outer disk orbits. These orbits are determined from the average motions (kinematic definition) or the average circular orbital velocity (dynamical definition) of stars or gas in the solar region. Galaxy Kinematics. Bertil Lindblad and Jan Oort were able to derive from these principles a way to calculate two Oort constants from the measured radial and proper motions of solar type stars of known geometric parallax and OB stars and Cepheid variables whose distances were estimated from their absolute magnitudes (spectroscopic parallax). The distance estimates to the stars, along with their galactic coordinates, were necessary to calculate the galactic orbital radius of each star and translate the proper motions into velocities (km s-1). The Oort constant A measures the local rate of change in shear with increasing galactic radius. The Oort constant B measures the rate of change in angular momentum with increasing galactic radius, which yields by subtraction the absolute speed of angular rotation at the solar circle. Given the solar radius (R0) in parsecs and the orbital velocity (Θ0) or angular velocity (Ω0) in kilometers per second, then:
The constant A can be calculated directly from the radial velocities of stars of known distances, but the constant B must be inferred from the average peculiar motions or velocity dispersion of the stars, which becomes smaller with increasing angular momentum and is therefore reduced for stars inside rather than outside the solar circle and more massive stars. The ratio in the amount of velocity dispersion between these inner and outer orbits is about rPM = 1.45. On that basis, the Oort constants at the LSR are estimated to be: A = 14.82 km s�1 kpc�1 The orbital velocity of the LSR is then calculated as: [4] Θ0 = R0Ω0 (where the currently adopted IAU value is 220 kilometers per second). This is 851,760 kilometers per hour, which is not especially fast in relation to astronomical distances: it is equivalent to traveling the distance from the Earth to the Moon in 27 minutes, to the Sun in 7� days, or to Neptune (at opposition) in 7 months. But it is not slow, either, in terms of astronomical orbits: the Earth's orbital velocity around the Sun is about 30 km s�1, and the Moon's orbital velocity around the Earth is about 1 km s�1.
The solar peculiar motions are the values of U⊙, V⊙ and W⊙ that produce the smallest apparent velocity dispersion in the motions of other bodies. Different observational strategies or selection of objects have been used to define the average motion, but most use a sample of thousands of stars in most areas of the sky. Note that the dispersion or variability in the velocities of stars depends on their mass and age, as well as membership in distinct star streams. Early type (most massive and short lived) O, B and A type stars tend to have a higher orbital momentum and therefore a lower dispersion than late type (least massive and long lived) G, K and M stars (diagram, right).
The stellar population has been dissected into various stellar streams or subpopulations based on discrete clumping in the distribution of the stellar kinematics (diagram, left). The latest estimates of the solar peculiar velocities (from Reid & alia, 2014) are: U⊙ = 10.7 km s�1 [solar velocity toward l = 0�, the galactic center] which is a peculiar motion of 20.9 km/sec toward the solar apex at l = 55� and b = +25�, roughly in the direction of Vega (alpha Lyrae). (The currently adopted IAU values are U⊙ = , V⊙ = and W⊙ = .) The Sun's orbital velocity is then: [5] Θ⊙ = Θ0+V⊙ The solar angular rotational velocity is: Ω⊙ = 252.2/8.34 = 30.24 km s�1 and the solar orbital period is: [6] P⊙ = 2π/Ω⊙ which is more than 10% less than 20th century estimates. The procedures used to estimate the solar radius, Oort constants, local standard of rest and the local and solar rotational velocities � all parameters measured within a moving frame of reference � are intricate and sensitive to assumptions, methods and samples. Across recent studies, the variation of these estimates around the mean values is 10% or more. For example, the range of recent estimates for Θ0 is between 215 to 260 kilometers per second, and for Ω0 is from 26 to 32 kilometers per second. Best estimates are converging toward Θ0 = ~235 km s�1, only 7% greater than the current IAU recommended value, and most estimates of V⊙ suggest that Θ⊙ = ~250 km s�1. Despite the uncertainties, the differential rotation of the galactic disk is well established and the biases in the measurement of solar and stellar kinematics are better understood. Distance and Radial Velocity. We next turn to the use of kinematic analysis to derive estimates for the rotational velocity across all galactic orbits, or the rotation curve of the Galaxy. This is of fundamental importance to understand the distribution of mass within the galactic system.
The diagram (left) illustrates the basic trigonometry of kinematic analysis. Given the solar radius R0 and solar orbital velocity V(R0), we typically want to find the true radius R, distance d or orbital velocity V(R) of some distant object, such as a star or H II region, for which the astrometric parallax is too small to measure reliably. From the Sun's location the object is located on the line of sight toward galactic longitude l, which creates the unmeasured angle θ between the solar and stellar radius. We can obtain a physical measure of the radial velocity Vr (in kilometers per second) along the line of sight, but this is not the true velocity V(R); we have the angular size of the proper motion (in arcseconds), but this cannot help us calculate a tangential velocity (Vp) unless we also know either R or the distance d along the line of sight. (For simplicity, motion up or down within the disk is disregarded.) The solution starts with the fact that our line of sight must pass through some point t that is tangent to some unknown orbit (cyan circle). Because the line of sight at this point is tangent to the circular orbit, any object at that point in that orbit will be moving directly away from us, so the measured radial velocity Vr is also the true orbital velocity V(t) for that orbit. The orbital radius at t can be calculated as [7] R(t) = R0�sin(l) the galactocentric angle θ(t) is 90�l, and the distance d(t) is calculated by using the cosine in formula [7]. Finally, because we now have both V(t) and R(t), we can calculate the angular orbital velocity by rearranging the terms in formula [4]: Ω(t) = V(t)/R(t). The application of this arbitrary measurement is possible because V(t) is the maximum radial velocity visible along that line of sight. Because t is the closest point to the galactic center, all other orbits that are crossed by the line of sight are outside the cyan orbit and must have a lower orbital speed � either because they have a larger radius and a lower orbital velocity, or because we do not view those orbits tangentially but with an increasing part of the radial motion transferred into proper motion, making the measured radial velocity less than the orbital velocity. The radial velocity along the line of sight (V||), calculated as [8] V|| = R0�[ Ω(R) � Ω(R0) ]�sin(θ(R)+l) reaches its maximum value for any value of Ω(R) when θ(R)+l = 90�. So we have a method to analyze the kinematics of the Galaxy: point our measurement instrument at each longitude along the galactic equator, measure the maximum radial velocity visible at that point, and index that velocity to the calculated tangent radius and galactocentric angle. This defines the Galaxy rotation curve for all orbits out to the solar radius. (Velocities outside the solar circle are measured using objects whose distances can be estimated using other methods, for example photometric parallaxes to Cepheid variable stars or giant H II regions.)
The most recent Galaxy rotation curve (Sofue et al., 2009; image, left) shows the orbital velocities out to 15 kiloparsecs. The curve shows relatively small but possibly structural variations. The three that appear across different studies over the past few decades are (1) a rising peak within ≤2000 parsecs of the galactic center, (2) a minimum at around 3000 parsecs, possibly due to the effect of the 3 kpc radius "boxy" bar and molecular ring, and (3) a second dip at around 9000 parsecs that may be the trace of an outer ring structure in the Galaxy. However, the difficulty of measuring orbital velocities in objects outside the solar circle and the variability of measurements at every radius (red dots) makes it feasible to adopt a flat or very slightly upward sloping rotation curve for orbits >3000 parsecs: Reid & alia (2014) propose 0.2 km s�1 kpc�1 (dashed red line). The fact that the rotation curve is basically flat has been known for over two decades (cf. Clemens, 1985), but it raises a serious problem. According to the Newtonian dynamics of Keplerian orbits, this curve should decrease with increasing radius in a gently sloping curve. The fact that it remains flat or even slightly increases with orbital distance indicates that there is a greater gravitational force at work than we can account for in terms of the visible stars and gas in the Galaxy. Although this is literally confirmation of an excess gravitational attraction, with the source of the excess gravity entirely unknown to us, it has been approached as an invisible mass problem, and evidence for the existence of "dark matter" that for some reason we cannot see. The problem is not illusory or peculiar to our Galaxy, since "flat" rotation curves are observed in other galaxies and there are effects of gravitational lensing in galactic clusters that are in excess of the visible cluster mass.
Kinematic Distance Estimates. [DRAFT] The rotation curve. [9] V(R) = Vmax + R0�Ω0�sin(l) And so on. And so on. Origin of Spiral Arms. [DRAFT] The spiral arms are really "gas to star transformation machines" (Dias & L�pine, 2005) and are often outlined by "beads on a string" series of star forming and H II regions. By contrast, very little or no star formation occurs in elliptical (armless) galaxies. Structure of Spiral Arms. [DRAFT] The spiral arms are really "gas to star transformation machines" (Dias & L�pine, 2005) and are often outlined by "beads on a string" series of star forming and H II regions. By contrast, very little or no star formation occurs in elliptical (armless) galaxies. The corotation radius is the distance from the Galactic center where stars and the spiral wave pattern rotate at the same speed � they are stationary to each other. Spiral galaxies are star forming instabilities that attract matter, swirl it into a gravitational potential, and shock the matter to produce stars. By an elaborate and turbulent cascade the kinetic energy of infalling and revolving matter is transformed into shockwaves of light, the spiral arms of the galaxy. The classic pattern consists of a pair of opposed large shock waves, which often divide into smaller arms and spurs. These are very slow moving standing waves, which can persist for many galaxy revolutions if there is a satellite galaxy or long central bar to contribute energy.
The classic pattern consists of a pair of opposed large shock waves, which often divide into smaller arms and spurs. These are very slow moving standing waves, which can persist for many galaxy revolutions if there is a satellite galaxy or long central bar to contribute energy. Waves form spontaneously in galaxy simulations: the questions are what causes the diversity of forms and how long the waves persist. A recent estimate by Dehnen (1999) suggests the central bar has an angular rotation speed of 53 �3 km s�1 kpc�1. The spiral arm corotation radius would be at ~0.55R0 or 4600 parsecs and the outer Lindblad resonance at ~7700 parsecs. Star Formation in Spiral Arms. [DRAFT] William Herschel was perhaps the first to surmise that the luminous matter of H II regions and planetary nebulae was "fit to produce a star by its condensation." The large proportion of binary stars and the wide range of binary orbital characteristics seem to require the twin conclusions that most individual stars originally form as binary or multiple star systems and that most or all star systems form as members of a star cluster. Thus a basic understanding of star formation processes and the role of star clusters in their early history is essential to put double star systems in the Galactic context. The molecular clouds involved in star formation are described hierarchically, in order of decreasing average size and increasing density, as: (1) supergiant molecular clouds (SGMCs), with maximum dimension of around 1000 parsecs and masses of around 107 M⊙, which comprise (2) giant molecular clouds (GMCs) about 100 parsecs wide with masses of about 105 M⊙. Each GMC into the (3) GMC envelope constituting the exterior surface of the GMC and the (4) molecular cloud cores inside it.
The entire sequence is exemplified by this detail (image, above) of a Hubble legacy image of M51, a grand design spiral galaxy in Ursa Major. The spiral arm shock wave orbits at a different speed than the stars and interstellar material. This compresses clouds of molecular gas and dust as they pass through the arm, where gravitational collapse of dense cores first occurs. The first H II regions, which signal the birth of the most massive stars, appear embedded in and on the exit side of the arm. They are gradually dispersed by stellar radiation to reveal naked star clusters and OB associations. The clouds shred into remnant filamentary structures as they exit the spiral arm, and these filaments show secondary star formation occuring in the interval between spiral arms. The Spiral StructureThe hypothesis that the Galaxy had a spiral form gained traction after Isaac Roberts and James Edward Keeler documented spiral galaxies with astrophotographs taken in the 1890's. However the hypothesis was not confirmed until the 1950's, and the half century of research since then has only partly clarified the Galaxy's overall structure. In this section we review the available evidence. A Recent Spiral Diagram. It will be useful to start with a currently accepted model, in the illustration by Robert Hurt at NASA (below) published as "the best visualization of the face-on Milky Way constrained by the currently available data" (Churchwell & alia, 2009). The mouseover diagram reveals the spiral arm labels, the cardinal points of galactic longitude, some important angles of longitude, and the length and orientation of two bars in the spiral nucleus.
Place cursor over image to reveal labels. (Note: Galaxy diagrams conventionally place the Sun above the galactic center.) In plan view, the Galaxy disk is divided into four quadrants, by a line extending the solar radius from the Sun through the galactic center of rotation in Sagittarius, and a second line through the Sun and perpendicular to the first. These lines define the four cardinal points of galactic longitude, with the center of the Galaxy at 0�. Viewed from its north pole, the Galaxy rotates in clockwise direction, so that all objects in Quadrants I & II are ahead of the Sun and objects in Quadrants III and IV are behind it. As described above, the best current estimate for the solar radius (R0) is 8340 �160 parsecs (27,200 light years), the value adopted in diagrams on this page. Since the late 20th century, discussion of the Galaxy structure has generally been framed in terms of a central bar and two or four major spiral arms (where a spiral arm is a continuous structure that originates in the galaxy nucleus): Central Bar � Star density observations in the infrared indicate the nucleus of the Galaxy is elongated into a bar. Depending on the survey, there appears to be either a "narrow" bar about 8800 parsecs long and oriented about 45� to the solar radius, or a "boxy" bar about 6600 parsecs long and 2600 parsecs wide, oriented about 22� to the solar radius (my diagrams show both). The "boxy" bar is the better documented and apparently more massive (≥20 billion M⊙) feature. In galaxy surveys similar central bars are found in 60% of spiral galaxies (when observed in the infrared) and these barred galaxies are also grand design or symmetrical spiral galaxies about 70% of the time. Although bars are clearly correlated with strong spiral arm figuration, the mechanisms by which bars might generate or sustain a spiral structure are unclear. (1) Sagittarius-Carina � About 260 parsecs wide and 1000 parsecs distant at its nearest point, this spiral arm originates in the far end of the "boxy" bar and extends across the sky from Aquila to Carina but with a rich concentration of star clusters and star forming regions in Sagittarius. Two angles of Galactic longitude indicate the preceding (50�) and following (285�) radial velocity tangents that indicate the widest circumference of the arm as viewed from the Sun; these bracket a 125� span of concentrated stars, gas and dust that limit our inward view of the Galaxy. Although depicted in the image as less prominent, the Sagittarius arm is one of the most clearly defined parts of the spiral structure and contains some of the brightest and largest star forming regions known, as indicated by the continuous arc of high density hydrogen clouds through quadrants I and IV (c and e, diagram below). (2) Scutum-Crux (called Scutum-Centaurus when a two arm spiral model is asserted) � Located beyond the Sagittarius arm in the direction of the galactic center, this arm originates at the near end of the "narrow" central bar, about 6000 parsecs away, arcs in front of the galactic center (about 2600 parsecs from the Sun at its nearest point), then curves behind the nucleus where it disappears from view. In most representations is shown as more massive than the Sagittarius arm, but we have a less certain image of this feature because we must view it through the Sagittarius arm and have identified fewer spiral arm tracers within it. (3) Perseus (Perseus when a two arm spiral is being described) � Corresponding to the Scutum-Crux arm, this arm originates in the far end of the "narrow" central bar and curves around the Galaxy to form part of the visible outer span of the Milky Way opposite the galactic center, between Cygnus and Puppis, at a nearest distance of about 1900 parsecs. (4) Norma-Cygnus � This arm appears to originate in the near end of the "boxy" central bar, circles behind the galactic nucleus, and curves outward beyond the Perseus arm (where it is usually called the Outer arm) at a nearest distance from the Sun of about 5400 parsecs. Other structures identified include: 3 Kiloparsec Arms (sometimes the Expanding arms) � First identified in the 1950's, these are concentrations of molecular gas and stars that wrap around the bar nucleus. They do not show significant star formation, as star formation tracers (H II, masers, ionized gas) are absent. They may simply be "wake" features created by the turbulent attachment of the Perseus and Scutum-Centaurus arms to the central bar(s). Local Arm (sometimes the Local spur, Orion arm or Orion-Cygnus arm) � As traced by star forming regions, star clusters and OB associations, the Local Arm is the nearest large galactic structure to the Sun. We trail behind the arm in galactic rotation but the Sun's orbit may carry it through the arm in the next tens of millions of years. Two angles in the diagram (60� and 240�) define a line approximately parallel to the trailing edge of this structure, but the point where the Local Arm inserts into a larger spiral feature is not known. Originally defined as a mere spur or appendage to a major spiral arm, recent research suggests it is about 380 parsecs thick and a relatively massive galactic structure. The mouseover diagram shows three concentric circles that illustrate limit magnitudes for visual observation. The widest at 3600 parsecs indicates the spherical area within which a spectral type O5 star (and most supergiant stars) will appear to have a visual magnitude of 10.5 or greater, taking into account the effect of interstellar extinction within the galactic plane (in visual wavelengths, about 1 magnitude for every 1000 parsecs). The two inner circles show the equivalent horizons for type B5 (1250 parsecs) and A5 (410 parsecs) stars; solar type stars (spectral types F, G or K) will be much fainter than magnitude 10 even within the 400 parsec radius.The largest (dotted) circle shows the estimated sample limit of the GAIA astrometric survey satellite for stars of the greatest intrinsic brightness. Actual limit magnitudes will depend on the aperture and sensitivity of the observing instrument, but all will operate within similar distance/limit flux proportions. Our understanding of the Galaxy is fundamentally limited by the spatial selection function or Malmquist bias of our instruments, which means that distant, dim or closely spaced objects are underrepresented in any brightness limited sample. In contrast, distance limited samples are presumed to be exhaustive within a specified volume, but these also must reach a resolution or brightness horizon and (depending on the objects surveyed) are limited in practice to a volume within a few tens or hundreds of parsecs of the Sun. Without interstellar extinction and the angular crowding of stars viewed at great distances, these horizons would increase by as much as four times in many directions through the galactic disk. To overcome these limitations in the visual wavelengths, with few exceptions objects beyond ~1000 parsecs are studied primarily in the xray, infrared or microwave (radio) wavelengths. Fitting a Spiral Model. How have we been able to uncover this spiral structure? The basic procedure is to identify and determine the distance of spiral arm tracers, objects or structures asssociated with the spiral arms observed in other galaxies, and use them to outline the contour of spiral arms in our own. As explained above, the first tracers to map the local Galaxy were massive and very bright stars whose distances could be determined by spectroscopic parallax and that had very short lifetimes, which meant they remained close to the place where they formed. These tracers were soon augmented with surveys of young star clusters, OB associations and H II regions that appear near the end of the star formation process. The limitations of visual wavelengths were overcome by radio telescope observations of clouds of the H I or atomic hydrogen, and the carbon monoxide (CO) associated with molecular hydrogen (H2) that is a principal feature of mature star forming regions (Dame & Thaddeus, 1985). Because radio wavelengths are not obstructed by interstellar matter, they can be detected at very large distances, albeit at very low resolution. More exotic methods used to trace the spiral structure have included synchrotron or infrared emissivity, interstellar extinction, xray binary stars, magnetic fields and electron densities, the motions of Cepheid variable stars, and infrared surveys of the number (density) of solar type stars. The next step is to resolve the spiral pattern suggested by these identified tracers. Experience has shown that this "connect the dots" approach is fundamentally judgmental (unreliable) so, following an exhaustive photographic analysis by Carl-Gustav Danver (1942) of the logarithmic form of 98 nearby spiral galaxies, the analysis is disciplined by assuming that the tracers lie along regular logarithmic curves. This means the arms follow the functions: R = a�2.71828(α�φ) and φ(R) = ln(R/a)/α where φ(R) is the galactic azimuth angle φ for the radius R, the "intercept" constant a rotates the azimuth position of the curve to match the location of the spiral arm, and the pitch angle (ψ) or slope of increasing radius is ψ = arctan(α); a smaller pitch angle means the arms are more tightly wound. These curves are constrained by the known location of radial velocity tangents, points in galactic longitude where the relative velocity of radio sources appears to peak then abruptly decrease, which indicate the outer edge of rotating material viewed against a slower moving background. (Only tangents inside the solar radius can be detected.) The diagram (below) shows (on the right) a plan view of typical spiral arm tracers and (on the left) a plot of the tracers by galactic azimuth and log radius, repeated twice to include spiral arms that cross the 0� longitude. In the azimuth plot spiral arm tracers forming a constant logarithmic pitch angle will lie along a straight line. The spiral arm challenge is simply to find the fewest number of straight lines that fit the largest number of tracers in the log diagram.
Place cursor over image to insert spiral solutions (adapted from D. Elmegreen, 1985) It is sobering to discover (mouseover diagram) that both a two arm solution with a 6.5� pitch angle (red lines) and four arm solution with a 12.5� pitch angle (blue lines) can fit the data about equally well. Scrutiny reveals that this is possible because the logarithmic curves in each solution only fit part of the Galaxy: whatever the preferred spiral solution, it typically misses as many data points as it fits.
A Consensus Spiral Model. One way to increase our confidence in the spiral solution is to compare the results of independent studies that have used different spiral arm tracers and methods for fitting the logarithmic curves. Jacques Vall�e (2005) summarized the parameters of 62 research papers published between 1980 and 2005 that claim to identify the Galaxy spiral structure. This "consensus" spiral galaxy model (diagram, left) consists of four major arms with a pitch angle of about ψ = 12�, with either one or two central bars, oriented as shown in the diagram. The Sun is located between the Sagittarius-Carina and Perseus arms, the Orion arm is discarded, and the solar radius is used to scale the dimensions of the rest of the Galaxy. The five most important radial velocity tangents are also shown with their locations in galactic longitude. Despite the large number and diversity of studies, Vall�e's "consensus model" replicates almost exactly the four arm model proposed by Georgelin & Georgelin in 1976 (above). Although often challenged, it has been the most often cited model of spiral structure for three decades � and the names the Georgelins gave to the four spiral arms have stuck. The most important addition to the model is resolution of the massive, "boxy" central bar about 7 parsecs long and inclined to the solar radius by ~20�, and a second, "long" bar inclined by 44�, as shown in the diagram. The competing "grand design" model of the Galaxy is a two arm spiral pattern. One of the better documented of these is the Churchwell & alia model, based on the Spitzer space telescope's GLIMPSE Point Source [Star] Catalog, which makes the Perseus and Scutum-Crux arms, originating from the central bar at a pitch angle of 14�, the dominant structures in the Galaxy (mouseover diagram, left). It adds the Sagittarius-Carina and Norma-Cygnus arms as secondary structures. The recent model by Steiman-Cameron et al. (2010) is nearly identical. Steiman-Cameron (2010) examined the methods and results in the spiral arm literature (reprinting a large sample of the solutions for visual comparison) and found that four arm models outnumbered two arm models by 4 to 1. He concluded that the difference in models reflected the type of spiral arm tracers used: two arm models of the Galaxy were based on "mature" stellar mass tracers (main sequence star density counts, K and M giants; orange in the diagrams), while four arm models relied on "young" and interstellar mass tracers (giant H2 clouds, star forming regions, H II regions, young star clusters and OB associations; violet in the diagrams). In particular, the Sagittarius-Carina arm shows almost no increase in the density of solar type stars but is well traced by gas clouds and star forming regions, while the Scutum-Crux arm is clearly indicated by an increased density of solar type stars. (Note also that the position of the "young" Norma-Cygnus [Outer] and the Sagittarius-Carina arms are relatively unchanged between the Churchwell et al. and Vall�e consensus models, but there is a significant outward shift in the location of the "mature" Scutum-Crux and Perseus arms.) The opposing two or four arm models of the Galaxy structure are not simply due to methodological differences, but indicate basic structural differences in the spiral arms themselves. Many other factors contribute to our uncertainty about the spiral structure. Because we must look through the Galaxy plane rather than down on the Galaxy plan, features are superimposed along our line of sight. Spectroscopic distances are distorted by interstellar extinction, and we can see farther in some directions than in others. Parallaxes are difficult to obtain for distant, extended or long wavelength sources. Distances estimated from radial velocities depend on the rotation parameters selected, and for objects inside the solar circle there are two orbital positions that will produce the same radial velocity. Within an angular wedge of about 15� at either end of the solar radius, radial velocities become smaller than measurement error and effectively disappear. For most objects, available methods yield estimated distances with errors as large as 20%. Finally, the "tracers" used to limn spiral arm patterns are not consistently related to the spiral arms themselves. Louie & alia (2013) summarize conflicting results in the literature and show that some tracers are better than others. Apparently stars and gas do not lie in the same location, spiral arms are so frequently bent and broken as to thwart logarithmic summary, and the utility of specific tracers varies from one galaxy to the next in ways that may depend on the galaxy mass, age, rotational speed, distance from the galactic barycenter and other unique factors. The Vall�e consensus model is a useful but optimistic gloss on the literature. In contrast, Xu & alia (2013) comment: "At present, there is no general agreement on the number of [Galaxy spiral] arms nor on their locations and orientations" (p.2). Perhaps the single largest obstacle is that galaxies are turbulent systems, and spiral structure is what appears when turbulence is well below the resolution limit. From our up close vantage inside a spiral galaxy, it is very difficult to see the grand design spiral forest for the turbulent tracer trees. But the 100 or more competing spiral solutions in the literature belies the remarkable similarity between the Churchwell et al. and Vall�e proposals. The Inner Galaxy. Adopting a prudent skepticism of spiral models, and keeping the consensus model as a consistent frame of reference, let's turn to the current knowledge of spiral arm tracers and the structure they may reveal. The image (below) retains the Vall�e consensus model as the spiral arm framework, but lays over it (1) the H II and giant molecular cloud (GMC) data from Hou, Han & Shi (2009), (2) the galactic survey of infrared dark clouds by Jackson & alia (2008), (3) methane or water masers associated with rapidly accreting protostars found in high mass star forming regions (HMSFRs) at distances measured with very large baseline radio arrays by Reid & alia (2014), (4) the RMS survey of high mass star forming regions (HMSFRs) and compact H II regions by Urquhart & alia (2014), which is said to be complete for SFRs with luminosity above 20,000 L⊙, and (5) in the background, the density contours of atomic hydrogen mapped outside the solar radius (Ro) by Levine & alia (2006, discussed below).
Place cursor over image to display only the spiral arm tracers. In the diagram, the Sun is enclosed within two circles indicating the 5000 parsec radius encompassing the Local Arm and the 600 parsec radius enclosing the Solar region. The solar radius or solar circle is shown at the consensus distance of 8340 parsecs. The spiral arm locations and pitch angles imputed by Reid & alia (2014) are shown as colored lines (double lines to indicate their contour of the Local Arm, and single lines to indicate the center of the Outer, Perseus, Sagittarius and Scutum arms). Dashed lines indicate the galactic dimensions U (radial direction) and V (rotational direction) on the kiloparsec scales shown at the left and top of the image. White letters refer to the text below.
This image is if anything too dense with information � but this illustrates the difficulty of finding an unambiguous pattern in the evidence. However, limiting the diagram to only the largest mass objects in each category (diagram, right) does not significantly improve the pattern resolution. The evidence is compromised by irregular patterns of extinction or obscuration, a historical lack of measurement capabilities in the southern hemisphere, a lack of consensus as to what counts as the minimum mass necessary for a reliable spiral arm tracer, and the greater resolution possible with nearby objects, which results in swarms of many small mass tracers near the Sun but a few apparently large mass tracers at distances where smaller mass sources are lumped together. However, by limiting focus to the less ambiguous features of the image, several reliable generalizations are possible. These are structural facts that any model of the Galaxy must explain. � There is a large concentration of molecular hydrogen (H2) in Quadrant I, inside the solar circle (a). This dense and finely resolved aggregation of giant molecular clouds (GMCs) is swept up behind the near end(s) of the central bar(s), and is mingled with a dense concentration of active star forming (H II) regions (magenta symbols, b). We cannot resolve the molecular concentration on the opposite side (a') due to the lack of visibility within ~15� on either side of the galactic center. Instead we pick up a large number of H II regions and massive young stellar objects (c) inside the Sagittarius-Carina arm, which are mirrored in Quadrant IV by a similar concentration inside the Norma-Cygnus arm (c') as the expectation of spiral symmetry would require. � There is a lack of molecular clouds inside the Sagittarius-Carina arm in Quadrant IV (extending from b to d), which is attributed to the lack of radio GMC surveys in the southern hemisphere. However there is a similar lack of molecular clouds in the opposite (and well surveyed) region (d'), and there is a knot of molecular and H II sources on both sides (at the letter symbols), which implies the relative lack of molecular hydrogen inside the Sagittarius-Carina and Norma-Cygnus arms is real, while the lack of GMCs at a' and c' is insufficient data. � The Sagittarius-Carina arm is traced very clearly and out to a great distance in Quadrant IV (e), but there is a contrasting lack of similar tracers across much of the Outer arm. This asymmetry also appears to be real. (The Sagittarius-Carina arm contour is often a predominating feature in the fitting of logarithmic pitch angles for the whole Galaxy.) � There is a massive molecular and H II concentration on the solar circle at about l = 80� (f) at a mean distance of about 4500 parsecs. This feature becomes significant in some recent models of the Local Arm (Xu & alia, 2013). The diagram (above) shows the Local Arm contour as measured by Xu & alia (2013), which suggests it is about 330 parsecs wide, concentric with the Sagittarius and Perseus spiral arms with a pitch angle of ψ = 13�. Weaver (1970) identified a 60� radio tangent and suggested that the Local Arm inserts to the Sagittarius Arm at around the massive star forming region W 51. Other evidence suggests the Local Arm may extend farther, possibly inserting at the massive star forming turbulence around G045 (d).(I return to this issue in the next section.) � There is in Quadrant II a massive disruption of both the Perseus and Outer arms, which seem to merge in a single large aggregation of gas and star forming regions (g). There is no matching concentration on the opposite (and poorly observed) side of the Galaxy. (The large gap around l = 180� is again due to the radial velocity ambiguity across the line of sight.) � There are several large clouds of matter in Quadrant III (h) that appear to be streaming inward toward the Solar location. These are also not mirrored on the opposite side of the Galaxy which implies that the mass asymmetry is real. � Finally, although the estimates depend on precarious assumptions, the spiral pattern corotation radius, or the distance at which the presumably stable and persistent spiral arms and the stars within them rotate the Galaxy at the same speed, is generally placed at a distance of about 9000 parsecs from the galactic barycenter, or just outside the solar circle. It is usually assumed that star formation is much less active outside this corotation radius, and the sparseness of H II regions far outside the solar circle supports this conclusion. Before leaving this diagram, compare the fit of spiral arm tracers along the Sagittarius-Carina arm to the fit of other arms at other locations in the Galaxy. As one example, the tracers seem to lie within the Sagittarius arm at e, but lie between the arms at b and c. In other galaxies we also observe that star forming regions lie inside spiral arms in the outer galaxy but are funneled between the arms near the galactic center. Most spiral arm models attempt to fit tracers within the arms at all points in a galaxy, ignoring this basic transition in the placement of tracers within or between arms. The Outer Galaxy. Studies of the outer Galaxy are much fewer than those within the solar circle, but a study by Levine, Blitz & Heiles (2006) provides the best picture available (diagram, below).
Although the resolution is relatively poor and all features are elongated along the line of sight, several spiral arms are clearly traced out to a distance of 25 kiloparsecs. The nominal limit for Population I stars in the galactic disk is shown as a dotted circle, but we can assume that these arms would be traced as scattered aggregations of stars if viewed from outside the Galaxy. This indicates that the Galaxy is more than 38,000 parsecs and possibly as much as 50,000 parsecs (125,000 to 160,000 light years) in diameter.
The map also shows a clear asymmetry between the structures on the right (rotationally preceding) and left (following) sides of the disk. On the preceding side, most two arm models of the Galaxy structure assign dominance to the Perseus and Scutum-Centaurus arms, but it is clear from the Levine & alia data that these arms largely disappear as they pass outside the solar circle. In contrast, the Sagittarius and Norma arms emphasized by Amaral & L�pine (1997) appear more robust. The following side in Quadrants III & IV shows three clearly traced streams of infalling matter, the innermost becoming the Sagittarius-Carina arm. The apparently most massive outer two streams flow into the Perseus and Outer arms, and there is extensive fragmentation where both approach the Local Arm region. In fact, both outer streams appear to shear toward the Sun along the two pitch angles associated with definitions of the Local Arm (green and white dotted lines; compare the molecular clouds labeled h and the pitch angles defined in this diagram). There is clearly a large amount of matter falling into the Galaxy along the outer following edge of the disk, suggesting that this inflow contributes to the fragmentation and turbulence in the area of the Local Arm discussed in the next section. It is also tempting to associate this infalling matter with asymmetry in the galactic disk. A report by Nakanishi & Sofue (2003) mapping the three dimensional distribution of neutral (H I) atomic hydrogen is typical of studies that find a warp and tilt in a galactic gas disk that extends to a radius of about 17,000 parsecs. By combining their graded diagrams so that cyan/blue represents matter below the galactic disk and yellow/orange matter above the disk (right), the asymmetry appears a tilt of the southern half of the disk below the galactic plane by about 1000 parsecs and of the upper half by about 1500 parsecs.
A cross section through the disk along the galactic longitudes l = 80� and 260� (white line, upper diagram) shows that the disk flares to a larger thickness on both sides (lower diagram); it is widest in Quadrant IV, where the matter falling into the far Sagittarius arm is coming from above the galactic plane. The extreme depression in the disk is located at around l = 240� and has been associated with a stellar concentration that is controversally identified as the Sirius Dwarf galaxy. But comparing the cyan regions of this figure with the inner and outer mass streams of the previous figure shows a clear resemblance in location and extent that implies a causal connection. Similar vast streams of molecular hydrogen have been identified in other galaxies, most clearly in the Whirlpool Galaxy (M 51, NGC 111) as measured by Rots & alia (2010) (image, left). Indee, the argument has recently been made that the streams and warp are related to the tidal (gravitational) influence of the Large and Small Magellanic Clouds (Weinberg & Blitz, 2006). This and other studies reinforce the evidence for a large (~17 to 25 kpc) galactic disk with an asymmetric distribution of infalling matter and a disk that is thicker, warped and tilted in the structures farthest from the galactic center. A Physical Example. Hurt's diagram glosses over several complexities in the available evidence, which we can identify by examining the structure of a Galaxy believed to resemble our own. The image (below) is of NGC 1232, an SAB(rs)c (barred spiral) galaxy about 18.5 million parsecs distant toward the southern constellation Eridanus (l = 209�, b = �58�). This system has frequently been identified as closely resembling our Galaxy. With a radius of about 19,000 parsecs in the visual, a central bar about 4100 parsecs long, it is similar in Hubble type and size to the Galaxy and is even accompanied by an irregular barred satellite galaxy much like the Large Magellanic Cloud. These resemblances encourage some qualitative comparisons.
Place cursor over image to insert solar dimension and galaxy feature labels. Comparing this image to Hurt's rendition of our Galaxy (above), the most striking point of contrast is the beautiful gradation in both color and texture: from the featureless, yellow white central bar or nucleus, to the muted orange, tightly wound and finely flocculated inner spiral arms, through a grayish transition mixture from orange to blue in the widely spaced spiral arms, and finally the predominantly blue, clumpy and disjointed outer arms. The radial color gradation is a sign that this galaxy, like our own Galaxy, is a "green valley" system in transition from a rapidly star forming "blue" galaxy (emitting in the ultraviolet wavelengths of massive O and B stars) to an aging "red" galaxy (emitting in the long wavelengths of less massive but long lived K and M stars). Across these color changes the width and spacing of the spiral arms increases; in the outer galaxy bright knots of stars and long, broad lanes of dust and gas appear between the arms, and the arms are marked with many kinks or spurs. Comparison with M 74, the other analog identified by Humphreys, shows similar color and texture transitions. The satellite galaxy (which remarkably resembles our barred Large Magellanic Cloud) should be considered part of the dynamic picture, as these satellites appear around many spiral galaxies and are believed to affect if not generate the spiral arm structure. Although not visible in the image, globular clusters, halo stars, star streams, large scale gas feeds and a dark matter halo are found in most spiral galaxies. These components are part of the "spiral galaxy" concept. The 8300 parsec solar radius superimposed at the plate scale (green circle, mouseover diagram) allows comparison with the size of our Galaxy and focuses our attention on the galactic features that we would expect to find around the Sun. NGC 1232 has a slightly smaller diameter than the Galaxy and an inner arm spiral pitch angle estimated to be ψ = 14.5� to 25�, which implies that NGC 1232 is less massive than the Galaxy and has a lower shear rate between the arms. To compensate, the analogous solar radius should be located inside the projected solar circle, as indicated by the asterisk (labeled S). This analog of the solar neighborhood is outside the clearly defined inner spiral arms, in the "gray" transition zone to the clumpy, widely spaced and fragmented outer spiral texture. Even at this radius, the area between spiral arms is filled by a fleecy texture of stars and reticulated gas clouds, contrary to the transparent void between stars implied in Hurt's diagram. Outside the solar radius, the low density, irregular and disconnected clumps of stars correspond to the large scale spiral texture in the H I map of Levine and colleagues (above). NGC 1232 illustrates the difficulty we have in rigorously analyzing this outer texture, in contrast to method of fitting mathematical curves to the spiral arms of the inner galaxy. At around the solar circle each spiral arm begins to dissociate into structures that can be a branch or a spur, depending on mass and length, and reaches a break that either truncates the arm or abruptly changes its pitch angle, in several cases forming a straight ridge with an increasing pitch angle. Eventually even coherent branches and ridges break into detached star clouds, and a large number of knots appear that combine bright OB associations and star forming regions within a star cloud. Unfortunately there is uncertainty as to how these structures will ultimately combine to form inner spiral arms or even whether spiral arms in NGC 1232 or in our Galaxy are stable or transient features. Despite these uncertainties, as described in the next section this fragmented texture certainly characterizes the Local Galaxy around the Sun.
The large knots of bright stars just inside the solar radius correspond to the massive star forming regions visible in Carina, Scorpius and Orion. These become large and detached in the gray or slightly bluish transition from the inner galaxy, where the spiral arms are orangish and narrowly traced: this reflects the contrast between the knotty, star forming richness of the Sagittarius-Carina arm and the continuous solar type star density of the Scutum-Crux arm described above. NGC 1232 clearly shows a "molecular ring" encircling the central bar, and the visual density of material just outside this structure corresponds to the crowded and high mass H II regions observed in Quadrants I and IV of the Galaxy (a, b and c in the diagram above). Grosb�l & Dottori (2012) inventoried 3177 H II and star forming regions within NGC 1232, and this allows us to revisit the method of spiral arm tracers by looking only at the brightest 430 of these (diagram, right). From our vantage there is only minimal obscuration or observational bias, so we have a nearly uniform picture of the brightest tracers in this galaxy. Although the bare H II regions seem to clearly outline spiral arms in some areas, comparison with the photograph (above) reveals that many of these are actually spurs or chains of tracers across two different arms. In addition, when a symmetrical logarithmic spiral arm model that fits the K band outline of peak stellar densities is laid over the H II map (mouseover diagram), it shows no consistent relationship to the H II tracers. Thus, even when we have an unbiased sample of H II regions, they fail to identify either the visual or stellar density spiral structure. This demonstration has been repeated with other galaxy examples, several of them cited by Debra Elmegreen (1985). A Galaxy Sketch. Detailed comparisons between two large scale, turbulent structures are likely to be misleading. However, by keeping to the level of analogy and by comparing two galaxies that are morphologically very similar, it is possible to formulate a more realistic plan view of our Galaxy.
My Galaxy sketch (left) attempts an inclusive portrait of both the inner and outer Galaxy, and suggests the color and texture contrasts from nucleus to infalling matter. The resemblance to NGC 1232 and 628 (M74), and the shearing turbulence we call the Local Arm, is made explicit. Current images of the Galaxy are really images of an inner galaxy research method. "Beads on a string" tracers are identified through comprehensive surveys, then organized by means of a logarithmic spiral solution, with a constant pitch angle end to end, without regard to the distinction between tracers that lie within or between spiral arms or the common branching and breaking of outer spiral arms seen in other galaxies. These logarithmic curves are a mathematical hypothesis biased toward areas of the Galaxy where they are clearly defined, but they are fleshed out with texture simulations of stellar densities and H II regions, typically without regard to the actual and inconvenient location of these features, to simulate the Galaxy as a physical structure. In this approach the spaces between the spiral arms, where complex patterns of turbulence and fragmentation prevail, are rendered as featureless. By building up from the logarithmic curves, the research method, these images demote the texture and color variations, random disorder and angular spiral features obvious in other galaxies. There are important differences between schematic spiral models, such as the Vall�e consensus model, and Galaxy portraits, such as my sketch. Schematic diagrams present the logarithmic solution for what it is, a conceptual or mathematical summary of the big picture. If individual features are inserted, the purpose is to indicate the relationship of the model to the evidence, but these local features cannot guide the representation of structural details that are the main feature of the Galaxy portraits. Portraits in contrast represent the irregularity, discontinuity and turbulence of the galactic structure and its visible star formation processes. To the extent that texture variations, color gradations and spiral arm discontinuities are downplayed or eliminated, the portrait becomes only an elaborate schematic. As texture and turbulence are introduced to make the image more realistic, the actual location of tracers can be treated with the freedom that ambiguous distance estimates allow; the stellar arms can be traced to greater distances, beyond the high mass star forming regions that mostly appear inside the spiral arm corotation radius. The resulting portrait can depart in several respects from the schematic, but will represent the overall asymmetry, turbulence and contrasting stellar populations of the whole. The Local ArmWe turn from our foray into "grand design" galactic structure to the local galactic landscape. We start within a 5000 parsec radius from the Sun. This is an optimistic estimate of the distance at which most galactic objects can be both reliably measured with most methods of distance measurement and usefully studied with most methods of observation. It therefore comprises the area that presents a reasonably accurate and large scale picture of galactic structures around the Sun � although obscuration by stellar densities and interstellar matter means that our view is by no means complete within the horizon, a fact that will limit our interpretations. A Local Galaxy Map. The diagram (below) shows the Sun within a 10 kiloparsec square, comprising the area between the Outer arm and the galactic bulge to a great extent along the Sagittarius-Carina and Perseus spiral arms. As before, the mouseover diagram removes all labels so that structures can be examined independent of any interpretation.
Place cursor over image to remove labels and symbol keys. This image includes two new sets of data: (1) the OB associations catalogued by Sitnik & Mel'Nik (1999, blue dots binned by association diameter), and (2) young (<20 million years old) open star clusters from the catalog of Kharchenko & alia (2013, yellow dots binned by tidal radius: small = <5 parsecs, large = >10 parsecs). The map carries over from the previous diagram (1) H II regions and giant molecular clouds from Hou, Han & Shi (2009), shown individually throughout Quadrant IV and within the Sagittarius and Perseus arms in Quadrants I and II, and blurred elsewhere to reduce clutter; (2) the massive star forming regions and compact H II regions from Urquhart & alia (2014, blue and magenta symbols), (3) masers associated with high mass star forming regions located by Reid & alia (2014, white and orange dots), and (4) H I densities from the radio survey by Levine & alia (2006). The schematic spiral arms again follow the Vall�e consensus model. Spiral arms outlined in yellow provide the thin disk profiles in the Galaxy panoramas (below), including my suggested outline for the "crossing" Local Arm proposed by V�zquez & alia (2008). Outlines for the Local and Outer arms from Reid & alia (2014) are included, with two dotted lines to indicate galactic longitudes of 60� (white) and 80� (green) that parallel orientations proposed for the Local Arm. Lowercase white letter indicators of mass concentrations are carried over from the previous figure, augmented by uppercase white letters keyed to the text below. What Is the Local Arm? It has been traditional to summarize the OB associations, young clusters, giant molecular clouds and ionized (H II) star forming regions around the Sun as collectively forming a single large structure, the Local Arm (LA) or Orion arm. But what is the nature of this structure? There have been at least six distinct characterizations: 1. The LA is a major spiral arm up to 1600 parsecs wide, with a pitch angle of about ψ = 20� and contiguous with the similarly sized and pitched Sagittarius and Perseus arms (Bok & alia, 1970; Avedisova, 1985). The Sun is located inside the arm near the inner edge. 2. The LA is an extended (more than 5000 parsec long) branch of the Perseus spiral arm, lying closer to the Perseus than to the Sagittarius spiral arm and extending from the Sun at a pitch angle of about ψ = 10� to 20� (parallel to the dotted green line i = 80� in diagram above; Xu & alia, 2013). The branch may originate from a large star forming region about 6000 parsecs distant at i = 55� (labeled d' in the diagram above), or it may connect through a bridge of giant molecular clouds and ionized nebula lying 4500 parsecs away near the solar circle (f in the diagram). The branch is closer to the Perseus than the Sagittarius arm and the Sun is located inside the branch near its inner edge. 3. The LA is a large crossing feature that extends outward from the Sagittarius arm and cuts through the Perseus arm, where it connects with a large inflow of matter from the third quadrant (h in the diagram; e.g., Moffat & alia, 1979; V�zquez & alia, 2008). The Sun is outside the feature, within a few hundred parsecs of its inner edge. 4. The LA is a secondary or interarm feature (detached arm fragment) about 660 parsecs wide, lying between and approximately concentric with the Sagittarius-Carina and Perseus arms on either side at a pitch angle of about ψ = 13� (blue contours in diagram above; Reid & alia, 2014). This pitch angle would carry it back to insertion with the Sagittarius arm at the location of the large star forming region identified by the several masers within a few hundred parsecs of G045.07+00.13, about 8000 parsecs distant (labeled "G045" in the diagram, above). The Sun is inside the feature near the inner edge. 5. The LA is a spur or short extension from a true spiral arm (where a spiral arm by definition can be traced without interruption back to the galactic nucleus), defined by a radial velocity tangent in molecular hydrogen clouds around i = 65�. The spur extends outward from the Sagittarius-Carina arm from some point near or closer to us than the Sagittarius tangent (for example, from the massive star forming regions Westerhout 51 or G059.78+00.08) at a pitch angle of about 25� to 30� (parallel to the dotted white line i = 60� in diagram above; Weaver 1970). In the solar neighborhood the spur is roughly midway between the Sagittarius and Perseus arms, with the Sun located near the inside or trailing edge. 6. The LA is an illusory structure that appears primarily through the selective obscuration of parts of the local Galaxy by the uneven distribution of interstellar extinction (e.g., Piskunov & alia, 2006). The Local Galaxy map diagrams two contrasting definitions of the Local Arm: as a large feature coterminous with the Sagittarius and Perseus arms (after Reid & alia, 2014; parallel blue curves), and as a branch of the Sagittarius arm extending through the Perseus arm in Quadrant III (V�zquez & alia, 2008; parallel yellow lines). This arm is shown originating in W51 (following Avedisova, 1985 and Sato & alia, 2010), passing through the ON1, Cygnus X and Cepheus star forming regions, and continuing to the large molecular concentrations at F, with a pitch angle of ~30� near the Sun and an insertion into W51 at i = 50�. (This schematic arm was used to calculate the profile of the Local Arm in the visual panorama of the Milky Way.) The Local Arm is sometimes described as a combination of these proposals. Thus Avedisova (1985) used only emission nebula surrounding type OB stars to produce a model where the Local Arm is a major spiral arm 1600 parsecs thick with a pitch angle of ψ = 20� (1) that is contiguous with the Sagittarius and Perseus arms (3) but includes the star forming region W51 (1), although she notes that it might be a bifurcation or branch of either the Perseus arm (2; Urasin, 1987) or the Sagittarius arm (1). These overlapping proposals arise because researchers summarize different combinations of tracers, measure the distance of the same tracers in different ways, or use different criteria to identify a spiral arm or calculate its pitch angle. With few exceptions, researchers specify a pitch angle for the Local Arm between ψ = 10� to 30�, which defines a range of vanishing points for the preceding arm between i = 80� to 60� in Quadrant I and for the following arm between 260� to 240� in Quadrant III (in the diagram, dotted green and white lines through the Solar locus). Visually, the Local Arm comprises half the Milky Way. Preceding Local Arm Structures. All conceptions of the preceding Local Arm include the major star forming regions in Cygnus and Cepheus. About 1860 parsecs distant, Cygnus X is the largest and most active star forming region within 2000 parsecs of the Sun and one of the largest in the Galaxy: over 8200 protostellar objects have been identified within it. The Local Galaxy map (above) situates it among 7 HMSFR points (including W 75), a dozen young star clusters, and several OB associations and H II regions. The Cygnus OB7 region comprises a large dark cloud (Khavtasi 141, the Northern Coal Sack) about 800 parsecs distant, that lies in front of dozens of young stellar objects (YSOs) and Herbig-Haro objects around the "Braid Nebula" star forming region. The Cepheus SFRs identified with Cepheus OB2 and OB3, 600 to 800 parsecs distant, are among the most active star forming regions within 1000 parsecs; the Local Galaxy map identifies them with 4 masers (including Cepheus A), six OB associations, several young star clusters and H II regions, including IC 1396. These huge, fragmented assemblies anchor all models of the Local Arm: the challenge is to connect them with more distant features. The images (below) are details from the Dame, Hartmann & Thaddeus (2001) (top) radio intensity map, showing the 115 GHz carbon monoxide (CO) emissions, considered a reliable tracer of molecular hydrogen, as they appear in the sky 10� above and below the celestial equator, and (bottom) the radial velocity map of the matching area. As explained above, the horizontal zero velocity line represents objects in a circular galactic orbit at the solar radius (the solar circle); mass inside the solar circle will on average appear to recede from the Sun and therefore appear above the zero velocity line, while and mass outside the solar circle will appear to approach, unless near 0� or 180�, where disk rotational radial velocity disappears. The densest mass concentrations (strongest radio emissions) appear in red or white, the weakest concentrations in blue. The letter indicators of mass concentrations are included for reference, with locations of Galactic longitude anchored to a few named stars.
Download the complete radio intensity map (top image, 4830x950 pixels) or radial velocity map (bottom image, 3460x1090 pixels). The radial velocity map shows the Perseus arm approaching the Sun, traced in the highly fragmented texture typical of the outer Galaxy; beyond it, the scattered fragments of the Norma-Cygnus (Outer) arm, reduced in size by great distance, are visible in Quadrant I (l ≤100�). A major issue in Quadrant I is the lack of any observed extension of the Local Arm toward either the Perseus or Sagittarius arms (the empty area A in the diagram, above). This void may be structural or due to interstellar extinction along the Local Arm, but no large radio or H II sources have been identified beyond the Cygnus X formation. There is a long isthmus of H II regions from Cygnus X to the Perseus arm (f in the Local Galaxy map, and including the maser ON2) and a series of small concentrations strung from Cygnus X toward the Sagittarius arm at around W 51 (red concentrations below A). The area between G059 and W51 contains a significant density of matter that appears from the radial velocity diagram to be closer than the Perseus arm and possibly an extension from W 51. The visibly high stellar density across the Cygnus star cloud, placed by Baade (1934) at a distance of ~2600 parsecs, may identify a continuation of the connection from W51 or may be a bridge to the Sagittarius arm through the young star clusters and H II regions around G059 and ON1. In either case, the Cygnus X feature appears contiguous with the Cygnus OB7 star forming region, which is detached from the following Local Arm by the Cepheus gap, approximately at the galactic longitude of Alderamin (alpha Cephei). The radial velocity map shows a long concentration of molecular gas following CYG OB7 between the Cepheus gap and the Auriga gap (l = 105� to 160�), which is closest to the Sun at around l = 150�, near the galactic longitude of Mirfak (alpha Persei). The density map shows this mass consists of highly fragmented and interlinked clouds mostly located above the galactic equator and superimposed on our line of sight. Features in the Perseus arm are visible through this tattered screen, much reduced by their greater distance. This concentration forms the continuous Northern Rift from Cassiopeia into Cepheus, and contains a large number of star forming regions and young stellar objects in both the Local and Perseus arms. In summary, CO concentrations in Quadrants I and II clearly identify the large star forming region Cygnus X, the large molecular clouds in CYG OB7, and a nearby "Local Arm" visible as a wall of molecular clouds across Cepheus, Cassiopeia and Perseus that contains numerous star forming regions but relatively few young star clusters. The connection between the Cygnus structures and the Perseus or Sagittarius arms remains unclear. The Cepheus gap implies that the Cygnus and Local masses may be separate knots or clouds without shared dynamic membership in a single spiral arm. Following Local Arm Structures. The view into Quadrants III and IV clearly identifies the texture of fragmented molecular clouds and detached star forming knots and young OB associations that we have seen in both the outer Galaxy and at an equivalent galactocentric radius in NGC 1232. We therefore find much less evidence for a coherent spiral feature.
Download the complete radio intensity map (top image, 4830x950 pixels) or radial velocity map (bottom image, 3460x1090 pixels). The largest feature by far is the molecular assembly Gemini OB1, which includes a number of Sharpless objects and the nebula NGC 2174 between 1800 to 2000 parsecs away, distances that place this feature in the Perseus spiral arm. Masses associated with the Local Arm include the Taurus-Auriga star forming complex (about 140 to 200 parsecs from the Sun), the Orion star forming region (400 to 500 parsecs), and Canis Major OB1 (1150 parsecs), which includes the "double" open clusters NGC 2353 & 2343. These features align on a line parallel to l = 60� and about 400 parsecs behind the spiral arm hypothesized by V�zquez & alia (2008) to extend through a collection of molecular clouds and large young star clusters at 4200 parsecs (F). The CO density map clearly shows the perspective convergence and reduction in angular size in the more distant clouds, which can also be examined optically due to a relative transparency in the interstellar medium (the FitzGerald's window). The clouds dip below the galactic equator due to a ~1000 parsec downward warp in the galactic disk in this direction. A Local Arm parallel to a line toward l = 240� would converge to a point near Wezen (delta Canis Majoris), and several very distant star clusters are visible in this direction. Comparison of the two CO diagrams with the features keyed in the Local Galaxy map (above) illustrate the difficulty of tracing beyond the solar location a single feature answering to the conception of a Local spiral arm. In fact, there is a nearly continuous band of GMCs, H II regions and young star clusters athwart the hypothetical arm that includes the Carina nebula, the VEL OB2 association, CMA OB1 and GEM OB1 (from C' to C and beyond). There is no clear indication that either the Perseus or Local Arms continue beyond Gem OB1 into a field of highly fragmented features. The Local Assembly. The diagrams and discussion above suggest the following observations: 1. There is very weak evidence for a Local Arm consistent with the definition of a galaxy spiral arm � a continuous structure that can be traced back to the galactic nucleus. There is also weak evidence for a continuous structure marked by "beads on a string" H II regions. Remarkably, the view today differs very little from the map presented by Becker & Fenkert (1970): an extended (~1500 parsec long) and ill defined mass between the Sagittarius and Perseus arms, approximately positioned from Cygnus X through the Cygnus and Cepheus star forming regions and parallel to a line toward l = 60�. 2. There is ambiguous evidence for a Local spur or Local branch as a discrete extension from a spiral arm, due to a longstanding difficulty tracing the local structures back to either the Perseus or Sagittarius arms. The young star clusters and molecular clouds between W75 and G059 may indicate a "spur" attachment to the Sagittarius arm, or the large number of H II regions preceding the Sun along the solar circle (f) may indicate a branch out of the Perseus arm. 3. Complicating the structure of the solar neighborhood, there are two well defined aggregations of giant molecular clouds, star forming regions, H II regions, young star clusters and OB associations that lie between the Perseus and Sagittarius arms and oriented at an angle nearly perpendicular to the Local Arm: (a) a leading overdensity extending along a line approximately parallel to galactic longitude i = 145� and about 1000 parsecs ahead of the Sun in the galactic rotation, connecting the star forming regions and young star clusters around NGC 7538 and Westerhout 3 (B) in the Perseus arm, through the star forming regions in Cassiopeia and Cepheus, to the dense cloud of young star clusters in the Sagittarius arm that includes the Lagoon and Omega nebulae (B'). The Cygnus X formation, on a line from the Omega nebula to NGC 7538, may be a leading marker of this feature. (b) a trailing overdensity roughly parallel to the first but about 1100 parsecs behind the Sun, extending from the Gemini OB1 star forming regions around Sharpless 2-255 and NGC 2174 in the Perseus arm (C), through the Canis Major OB1 association, Vela OB2 association and Vela molecular ridge to the mass of young star clusters and star forming regions near the Carina nebula (C'). The mass of GMCs at D may be the trailing edge of this group. 4. These two "waves" of matter are separated by an interval that contains several young star clusters and OB associations but, apart from the Orion star forming region, very few H II regions or large molecular clouds, implying a late stage of stellar formation. This interval includes the local absence of gas and dust commonly associated with the Gould belt and ascribed to rapid star formation resulting from the collision of one or more giant molecular clouds with the Galaxy disk (e.g., Olano, 1982). 5. The two "waves" are perpendicular to the direction of matter infalling from Quadrant III that can be traced, in the outer galaxy, into two large spiral features outside the Carina arm. That is, there appears to be two channels of matter that may be approaching the solar locus approximately from l = 240� and 260�, dimensions long associated with the Local Arm. 6. Scattered throughout Quadrant III are young star clusters, cool giant molecular clouds and massive H II regions, and the intervals between these spiral arm tracers are often smaller across spiral arms than within them. This is consistent with the fragmented texture observed in similar spiral galaxies for material outside the corotation radius. These observations approach speculation to illustrate the turbulent, fragmented and complex structure of the Galaxy in the vicinity of the Sun. Compared to the scale of the Galaxy as a whole, the dimensions of the Local Arm appear too small to constitute a spiral arm, but large enought to be a branch or spur. Naming or classifying the Local Arm is a very low priority task in modern astronomy. Molecular clouds and H II regions are usually studied as discrete structures with the emphasis on understanding how stars form and how star formation is related to the mass and turbulence of the parent giant molecular clouds. The dynamic fragmentation of the visible structures indicates the risk of overinterpreting or misinterpreting the available evidence. The concept of an "Orion Arm" originated c.1970 when limited observations created a less detailed, more schematic picture of local aggregations and the rudimentary concept spiral arm was the only one available to interpret the patterns. It seems more accurate to locate the Sun in a region of turbulent fragmentation � a region that may include branching, broken or bent spiral arms, short or long spurs, detached star clouds and knots of star formation that have not yet aligned into a spiral pattern. The physical example demonstrates that fragmentation is the characteristic texture of spiral galaxies beyond the corotation radius, and in our Galaxy the fragmentation is made more turbulent by the asymmetric waves of matter falling into the "bent" galactic disk in Quadrant III. The Solar RegionThe next step in analysis is enormous area termed the Solar region. This is most generously defined as the area within a radius of 600 parsecs of the Sun, and most rigorously as the area within a 25 parsec radius. Why 600 parsecs? The principal concern is to define a volume limited (exhaustive and complete) sample of galactic objects, excepting faint stars, double stars and planetary systems, that can be surveyed without significant limitation from obscuring interstellar matter or by the faint absolute magnitude of the objects themselves (termed Malmquist bias). We not only want to see the object, we want to have a reasonably accurate estimate of its distance. The currently most accurate stellar parallax estimates (from the Hipparcos project) are reliable out to about 400 pc (a parallax of π = ~0.0025"), and spectroscopic parallaxes become unreliable beyond ~600 pc due to the accumulating obscuration of interstellar clouds. As explained above, stars with absolute magnitudes greater than Type A5 stars (M = 2.1) will be fainter than v.mag 10.0 at distances of about 400 pc. The 600 parsec radius. The diagram (below), compiled from recent research, shows the galactic plane within 600 parsecs of the Sun, as viewed from the galactic North Pole and with the Galaxy center toward the bottom. The diagram is crowded but labels can be removed by placing your cursor over the image.
Place cursor over image to remove labels. Click HERE for the labeled and full sized (1900x1900) image. The Sun is located on the interior and following side of the Local Arm, inside a large void, the Local Bubble, that is unusually lacking in gas or dust (Frisch, 2007). The nearest "wall" of cold, dense gas is about 55 pc distant at l = ~30� in Quadrant I. The Local Bubble connects through a number of tunnels and gaps with other star formation or magnetic bubble voids in the first and third quadrants (Lallement & alia, 2003). This gives us a remarkably unobstructed view of the nearby galactic landscape formed by the Thin Disk.
Similar bubbles are apparent throughout the Galaxy; a catalog compiled by Churchwell & alia (2006) from the Spitzer space telescope's infrared GLIMPSE survey lists over 320 of them (image, left). These bubbles form when the earliest to condense and most massive O and B type stars in a star forming region push back the remaining uncondensed cloud of interstellar matter with their UV radiation (image, left). The Orion nebula is a similar and much smaller bubble, as is the contour of Barnard's Loop. The image shows a relatively small bubble carved out by a single massive star (visible at the center). The bubble around the solar region is much larger and would have been created by a group of OB stars at the center of a forming galactic star cluster or a series of ~6 supernovae explosions (Ma�z-Apell�niz, 2001) associated by some researchers with the Gould Belt. The arrow extending from the Sun shows the direction of the Sun's roughly circular orbit and the distance (~250 parsecs) that the Sun will travel within the next one million years. The corotation radius (top of diagram) is the point at which stars and the Galaxy spiral arms revolve at the same speed. The table (below) keys the map icons and describes the features they represent, and lists sources for the data used.
Within the 600 parsec radius from the Sun the most massive stars are useful markers of galactic structure. The diagram below shows the nearby O, B and large A stars from parallax information in the combined Yale-Hipparcos-Gliese (YHG) catalog. The green areas encompass the clustering of these stars identified by Buoy & Alvez (2015) and presented as an interactive three dimensional diagram at the ESA web site.
Although our view beyond 200 parsecs is increasingly limited by interstellar extinction, there clearly are two bands of matter extending across the diagram from Quadrants I to III at approximately a 40� angle. There are two diminishing streams of B and a few O type stars that these structures continue into Quadrant III at least to 600 parsecs from the Sun. The long, continuous and massive Scorpius-Canis Major structure (lower left) is at a position and angle suggesting it may connect to the large group of nebulae and star clusters in the Sagittarius-Carina arm of the Galaxy that includes the Lagoon Nebula (see the diagram above). The Gould Belt. Reputedly the largest galactic structure in the Solar region, the Gould Belt is an apparently ringlike assembly of molecular clouds, star forming regions, and young stars, star clusters and OB associations encircling the Sun at a radius of about 300 parsecs. The Belt was first noticed by John Herschel in 1847, while observing in South Africa, as a corridor of unusually bright stars lying across the Milky Way band. It was later described and inventoried by Benjamin Gould as "a belt or stream of bright stars [that] appears to girdle the heavens very nearly in a great circle" in the text accompanying his Uranometria Argentina (1879, the "Flamsteed catalog" of southern skies). The appearance of the Belt is striking during southern spring nights, when the Milky Way is spangled with bright stars and OB concentrations, as the figure (below left) illustrates. The opposite view of the Milky Way during northern fall evenings is less impressive (figure, below right): although adorned with scattered bright stars, the Milky Way is faint and patchy from Cygnus to Canis Major. The tilt of the Belt away from the Galactic equator (green line) is obvious in the southern view, but substantially obscured in the northern view.
Click on each image for the full sized (1350x1350 pixel) version The very different appearance of the Belt in the northern and southern hemispheres arises from the position of the Local Arm. The northern view from Cygnus to Taurus is covered by the dark clouds of several active star forming regions and, toward the galactic center, the visually large areas of nearby dark molecular clouds such as the Cygnus Coal Sack and the Aquila Rift. In contrast, the southern view looks toward the products of star formation: new massive stars, dissolving star clusters and OB associations with dispersing molecular clouds and supernova shells. The form, dimensions and dynamics of the Gould Belt depend on the features used to define it, and different features seem to require different astrophysical explanations for its origin. Hough & Halm (1910) identified peculiar proper motions among the Gould Belt stars, and Edwin Hubble (1922) added nearby H II regions and molecular clouds. The diagram (below) summarizes the features currently associated with the Gould Belt, in galactic coordinates.
Click on image for full sized version There is quibbling in the literature as to whether the gould Belt is a ring, a disk, a cloud � or a sausage (Clube, 1967) � and there is research to suggest that it is more likely a "2D projection effect, and not a physical ring" (Buoy & Alves, 2015). A basic problem in all these studies is distinguishing Gould Belt objects from "background" galactic disk features � the problem of circular reasoning, or confirming your assumptions. If proper motion is used to distinguish Gould Belt stars from unrelated stars, then it is not surprising to discover that Gould Belt stars have unusual proper motions.
Its inner border is usually rendered as an elliptical ring about 360 pc long and 230 pc wide, but the disk of stars around this border extends out to about 600 pc with a scale height of 60 to 100 pc. The figure (right) shows that the disk is tilted from the Galactic plane by ~18� with the long axis approximately toward l = 45� and the ascending node at l = ~285� (it tips farthest above the galactic plane in Scorpius and farthest below in Orion). The Sun is displaced from the ellipse center toward the Scorpius-Centaurus OB association. The age of the Gould Belt is estimated to be 30 to 60 million years. Over 60% of OB stars within 600 pc and younger than 60 Myr appear to belong to the Belt, and the youngest (< 30 Myr) stars within ~400 pc in Quadrants III & IV are receding from the disk center. However, the kinematics of Gould Belt stars (as peculiar motions in relation to the local standard of rest) are highly disordered, due to the separate trajectories of the many different OB associations involved (cf. Torra & alia, 2000). Theories to account for the recent origin, tilt and kinematics of the Gould Belt include the collision of a ~107M⊙ molecular cloud with the Local Arm, or the gamma ray burst from a hypernova. Viewing the Gould Belt as a large, active star forming region is consistent with the theory that the assembly resulted from a series of about 20 supernova explosions over the past 60 million years � a rate that is about 5 times the Galactic average. These explosions are linked to the many radio loops, nova remnants and neutron stars of varying ages within the region, and are invoked to explain the tilt of the disk to the galactic plane. Somewhat contradicting this "origin story" explanation for the Gould Belt the remarkable contrast between the Scorpius�Centaurus OB association and the Orion star forming complex. In the Scorpius-Centuarus region, an epoch of prolonged and spatially extended star formation, which produced no young star clusters or H II regions, has passed its peak: the extended Scorpius-Centaurus OB associations have dispersed their natal gas and are slowly expanding (see Elias & alia, 2009). In Orion, rapid, dense and centralized star formation seems to be nearing its climax: the area contains several dark clouds and H II regions, including the Great Orion Nebula; a dozen very young star clusters; three compact OB associations; and a burst in stellar radiation that apparently formed the Eridanus bubble. There does not seem a simple way to relate these very different structures to a single initiating event. It's also instructive to compare the Gould Belt with the concentration of H II regions and OB associations connected with the Cygnus Superbubble, about 2000 parsecs distant at l = 82� and about 600 by 450 parsecs large with a roughly horseshoe profile. This feature is also the center of extensive star formation and is characterized by a belt of molecular material, tilted to the Galactic plane by about 30� (see Uyaniker et al., 2001). The spatial contrast between star forming regions and OB associations is familiar from spiral arm dynamics, and it is not hard to find analogous environments in other spiral galaxies. For example, the yellow dot in the detail view of M 51 (above) is situated in an area relatively free of obscuring clouds but surrounded by star forming regions and emerging OB associations, with dimensions similar to the Gould Belt assembly. From our lucky vantage, the active star forming regions around us are consistent with the pattern observed near spiral arm shock waves and spurs. Dense molecular clouds and active star forming regions are predominately located "ahead" of us in Galactic rotation, within the area defined by the Local Arm; mature or completed star formation regions and many supernova remnants are located "behind" us in the span between the Sco-Cen and Ori associations. Interstellar Extinction. Another implication of the theory that the Gould Belt resulted from sequential nova explosions is that these shock waves would preferentially expand perpendicular to the Galactic disk, into the less dense edges of the Thin Disk. And the Sun is in fact located within a Local Chimney oriented approximately perpendicular to the Galactic plane. Seen from the side (Lallement & alia, 2003), this chimney extends completely through the Galactic disk (diagram, right). The open ends of the Chimney reveal approaching gas clouds that appear to have been expelled by the supernova explosions and are now falling back into the Thin Disk. The most significant feature of the Local Chimney is that it creates two "windows" in the areas of the north and south Galactic poles (NGP and SGP, images, below). These images illustrate the very large differences in extinction across the sky, depending on the direction in which the observer points a telescope. This affects the accuracy of spectroscopic parallax and the visual horizon of double star identifications. These windows allow our clearest and most far reaching views of the universe and the galaxy clusters, high redshift galaxies and cosmic microwave radiation that contribute to our understanding of cosmology. Heliocentrism aside, we do indeed seem to occupy a fortuitous but unusually advantageous location for the study of the Galaxy and the universe. This is the polar view; the gap in dust here is sometimes called the Lockman hole.
If we look instead parallel to the plane of the galactic disk, the dust collects within a very narrow band that is on average only about 50 parsecs thick. This gas disk is the densest concentration of extinction.
The areas of the sky directly above or below us are also proportionately richer in Population II stars, generally older stars that orbit within the Galactic halo and outside the disk of the Galaxy; these pass through the disk during their orbit. The finest local example is Arcturus, a Population II giant K2 star about 11 parsecs distant, that is above us in relation to the Galactic plane and closer to the Galactic center. It passed through the Galactic plane within the past tens of millions of years and will continue to recede from us in the direction of Virgo. Open star clusters have been used as probes of both galactic structure and interstellar extinction (Piskunov & alia, 2006). The graph (below) shows a running average of the number of open star clusters in the Dias-Lepine catalog per degree of galactic longitude. Some of the troughs correspond to areas of wide and dense interstellar extinction: the Great Rift, the Perseus dark cloud, the Lupus star forming regions.
The peaks may indicate areas of unusually low obscuration, such as the FitzGerald Window centered around i = 240�, but others can only be concentrations of stellar material. In particular, the peak at i = 72� occurs within the span of the Great Rift and is narrow enough to indicate a view directly through the Local Arm. The broader concentration around l = 240� is more ambiguous, as it coincides with a broad area of relative transparency. OB Associations. [DRAFT] The major features are identified in the image (below), with bubble icons or color panels to represent spatial distance. Visually we cannot see far beyond spiral arm tangents or inside them, but radio, infrared and xray astronomy can penetrate them. The Naked Eye Stars. There are 9046 stars brighter than magnitude 7.0 listed in the Yale Bright Star Catalog (1991), and until the 17th century they stood to human society as the celestial sphere, the limit of the visible universe and the fabric from which every culture cut its sky legends and myths. The chart (below) shows these storied stars in galactic coordinates, down to magnitude 6.5 with spectral type coded by color. (There is also a version including bright star names, here.) Roughly 96% percent of these stars are within 600 parsecs, which reinforces the conclusion that the visible sky is the very local Galaxy.
Click on the image for the full sized, labeled version (2616x1320 pixels, 363Kb) To dissect this local stellar concentration it is useful to focus on the 191 stars of magnitude 3.08 and brighter: these comprise the anchor alpha and beta stars for more than 50 traditional constellations and many of the brighter secondary stars in constellations along the Milky Way. To clarify the distribution of these brightest stars within the galactic disk, the diagram (below) shows their positions on the galactic plane within 400 parsecs of the Sun, binned by spectral type and luminosity class. Stars of a "giant" luminosity class (Ia, Iab, Ib, II and III) are indicated with large dots; stars along the main sequence (IV and V) are indicated with small dots.
Four features can be identified in this diagram: (1) Most (60%) of the 191 brightest naked eye stars are "giant" luminosity type I-III, and the same proportion (60%) of the 191 stars are within 100 parsecs of the Sun. (2) Main sequence type A, F, G and K stars are concentrated in the region within 50 parsecs of the Sun (type A giant or supergiant stars are relatively rare). Our night sky is so to speak a veil of local, faint stars laid across a sparse framework of distant, bright, massive stars. (3) Two groups of very bright and very hot OB stars are located in Quadrants III and IV, associated with the Orion star forming region (and constellation) and the southern sky Milky Way. (4) The 11 type M stars only appear as giants or supergiants, and 8 of these are found in Quadrants II and III, marking sites of recent star formation in this direction.
The relative importance in the naked eye night sky of giant and supergiant stars versus main sequence stars is shown by a count of the stars in each spectral type within 600 parsecs of the Sun (diagram above, left). This shows that roughly 75% of all naked eye stars are in the subgiant, giant or supergiant luminosity classes, and for the solar types (F to K) the ratio of giant or supergiant stars to main sequence stars increases from 65% to nearly 100%. The second diagram (above, right) indicates the disparity between distance and magnitude as a definition of the night sky. Separate curves show the cumulative number of stars by distance for main sequence stars only (thin line) and for main sequence, giant and supergiant stars combined (thick line). The closest naked eye stars are mostly main sequence F, G and K types, justifying the concept of a "solar type" solar neighborhood within about 50 parsecs; beyond 50 parsecs type A stars become more frequent, and are the most numerous type from about 100 to 200 parsecs. Beyond 200 parsecs K type giant and supergiant stars are the most numerous; main sequence stars less massive than type B fall below the naked eye magnitude limit, and only massive OB stars, or giant and supergiant A and solar type stars, are visible. This is a dramatic illustration of the Malmquist bias in which only the most luminous objects far beyond the solar neighborhood are visible to the naked eye. Using a telescope pushes back the magnitude limits but does not change the illustrated relationships between spectral and luminosity types, intrinsic brightness, distance and visibility. The picturesque conclusion is that the Sun is surrounded by shells or layers of different types. Nearest to the Sun the solar F, G and K types dominate, and plateau at about 100 parsecs where nearby type A stars � Sirius, Vega, Altair, Fomalhaut, Miaplacidus, Alioth, Menkalinan, Alhena, Castor, Rasalhague, Denebola, Alphekka, Mizar, Merak, Sabik, Alderamin, Phad, Zosma, Ascella, Sharatan, Rukbah, Zubenelgenubi, Cursa, Deneb Algedi, Cor Caroli, Talitha � form a naked eye network of stars in the night sky that is both bright and within 100 parsecs of the Sun. The Solar Neighborhood
Place cursor over image for labels to the type A stars. Click HERE for full sized image (1792x1794 pixels, 163Kb) This is only a sphere 50 parsecs in diameter, yet it contains roughly 2800 unique star systems. (Double and multiple stars with an orbital radius of less than 1000 AU are only represented in the graphic by the primary star; these excluded components would probably add another 1000 stars.) This works out to about 23 cubic parsecs for each star system, or an average distance between star systems of about 2 parsecs. Alpha Centauris (Rigel Kent), the nearest naked eye star to the Sun, is about 1.3 parsecs distant; the closest A type star, alpha Canis Majoris (Sirius) is twice as far at 2.6 parsecs. This sphere gives a good idea of the relative proportions of the different spectral types in the Galaxy: none of the extremely rare type O stars, only one type B star (alpha Leonis or Regulus) and just 32 type A stars, labeled in the image. In contrast, there are over 400 type F and G "solar type" stars, which make up the bulk of the stars we can see with the naked eye; but the largest proportion is held by the 600 type K and 1600 type M stars, a vast scree that must also include at least as many brown dwarfs. In this dim welter the 140 or so white dwarfs, remnant cinders of solar mass and larger stars, pass almost unnoticed, and the 31 giant class stars do not much brighten the scene. There are no larger features in this volume: no star clusters or nebulae of any kind. There are however several comoving groups of stars or star streams, stars with a common origin in a galactic star cluster or in the population of a dwarf galaxy or globular cluster absorbed and dissolved by the Galaxy. The most noticeable of these is the Ursa Major moving group, visible as the string of A type stars in the second quadrant of the diagram. The View From EarthTo conclude this long page, let's return to the visual Milky Way and examine its features from the perspective of what is known and conjectured about the Galaxy. I present the visual structure of the Milky Way in the two parts of the spectrum that have been most important to analyze it: the submicron wavelengths of photography that primarily transmit the light from stars, and the centimeter wavelengths of radio astronomy that primarily transmit the radiation from interstellar matter. The large scale form of the Galaxy is indicated by spiral arm contours, again using the Vall�e consensus model to define the distance of the spiral arms from the Sun and representing them with a scale height of 350 parsecs and a gas disk with a scale height of 50 parsecs. These curves describe the logarithmic model of the Galaxy, but are useful to convey a sense of dimensions and the visual size of the features at a distance. The Visual Panorama. The following three images divide the ESO Milky Way panorama into three sections, each a "wide angle" view of approximately 120� and galactic latitude. They are presented below in a reduced 800 pixel format and on separate pages, linked from the image captions, in the full scale 1500 pixel format. Each image is labeled and keyed with a diagram that appears when you place your cursor over the image (mouseover). A small key diagram shows the area of the galactic plane covered by each image, and there is a list of all the galactic objects labeled in the three images. The Central Galaxy (l = 280� to 55�). The central Galaxy, from Aquila to Carina, is the brightest and most spectacularly figured potion of the naked eye Milky Way panorama. Across this entire width we look into the Galaxy across the visual extent of the Sagittarius-Carina spiral arm and centered on the nearest point of the arm. All the matter visible in this section of the Milky Way is inside the Solar circle, closer to the galactic nucleus than is the Sun.
Place cursor over image for key. Click HERE for explanatory text with the full sized image (1500x701 pixels, 356Kb)
The toy spiral arms of the Vall�e consensus model have been used to estimate the visual profile of the Galaxy inner spiral arms � Sagittarius-Carina and Scutum-Crux � assuming a thin disk scale height of 350 parsecs and a gas disk thickness of 50 parsecs. The curving blue lines indicate the nominal extent of the Sagittarius-Carina thin disk and the narrower cyan contours its thin disk of gas and dust. The arm curves toward us from the Sagittarius tangent, about 4700 parsecs distant at l = 50�, into its nearest point about 975 parsecs away at l = 350�, then curves away into the Carina tangent, about 3900 parsecs distant at l = 285�. The high profile of the Sagittarius-Carina arm indicates that much of the Milky Way visible in this direction lies within that arm, while its narrower gas disk limits indicate that most of the dark clouds silhouetted against the background stars are closer to us than the arm. All naked eye stars with an absolute magnitude of M ≥ -3.5 (that is, all main sequence stars of type B1 or later) are closer to us than this arm. Only the thin disk of the Scutum-Crux arm is shown (yellow contours), stretching between tangents at l = 30� and 310�, both more than 6600 parsecs away. While much of the Scutum-Crux arm is obscured by intervening dark clouds, as the nearest and densest concentration of Solar type stars in this direction it contributes to much of the central brightness of the Milky Way, and imparts a distinctly yellow light due to its late type stellar population. From our viewpoint, the near end of the "boxy" central bar is centered at around 14�, extends roughly 30� in width and in height slightly above the Sagittarius arm. Its profile forms an ellipse (not shown) that encircles most of the Greater Sagittarius star cloud, located at the spout of the Sagittarius "teapot". This 5� wide area is too dense to be within the Sagittarius arm and too far below the galactic equator to lie in the Scutum arm: it is a direct view of the near end of the central bar through a fortuitous tunnel of low intersteller extinction known as Baade's Window. A similar but smaller window creates the Sagittarius star cloud (catalogued as M 24 or IC 4715), which provides a view as far as 3000 pc into the interval between the Sagittarius and Scutum spiral arms containing mostly young or "blue" stars, in contrast to the Greater star cloud which reveals the aggregate light from older, "yellow" or Solar type stars within the Scutum arm or the near side of the galactic nucleus. A remarkable texture of shredded and intertwined dark clouds of gas and dust is silhouetted against the Sagittarius arm, receding in perspective from the nearby Aquila Rift, Lupus, Pipe Nebula and Coal Sack dark clouds to farther, fainter concentrations much closer to the Sagittarius-Carina arm. This texture is visible on a galaxy wide scale in the dramatic disk photographs by the Hubble Telescope of the Sculptor Galaxy (NGC 253, below), a barred spiral 3.5 million parsecs distant that comprises about 100 billion solar masses. Clouds above the disk are not as dense as the clouds near or within the thin disk, a contrast visible in the Galaxy as the thinning density of the Aquila Rift as it rises above the galactic plane into the southern part of Ophiuchus.
The dark clouds nearest to the Sun have been outlined for contrast. Many of these comprise sites of active star formation or recently condensed star clusters. The Pipe Nebula (LDN 42 and 1773) is roughly 145 pc distant and is part of the Ophiuchus star forming region. Many small and very dense gobules of condensed gas and dust are visible nearby, including Barnard 68, the famous "hole in the Heavens" first observed by William Herschel. The Lupus star forming region is about 170 pc away, the same distance as the Scorpius-Centaurus OB association of some 300 stars, including many of the brightest stars in all three constellations. The Coal Sack is about 180 pc distant; the Aquila Rift, 225 pc distant and 80 pc thick, is the large end of the Great Rift that extends from Deneb through Aquila and upward into the star forming regions in Serpens and around rho Ophiuchi; it appears to divide the Milky Way in Cygnus into two bands. All these areas of dense gas and dust form a ring around the Sun associated with the Gould belt of bright southern hemisphere stars and OB associations. The key chart shows only a handful of the more than 400 galactic star clusters cataloged within this panorama. Because of the vast extent of the Aquila Rift the galactic longitudes l = 15� to 55� display the fewest open star clusters of any part of the Milky Way. The area from l = 315� to 0� is also sparse of clusters, due to the obscuring effect of clouds connected to the Lupus star formation region. Despite these impediments, the Sagittarius-Carina arm contains many of the largest star forming regions known, including Westerlund 51 (at the same galactic longitude as the Sagittarius tangent), NGC 6530 (M8 or the Lagoon Nebula), NGC 6611 (M20 or the Eagle Nebula), and NGC 3372 (the Carina Nebula). These include very young clusters such as NGC 6611 or 6618, each just 1 million years old, and a few "middle aged" clusters such as IC 4651 (an estimated 1.1 billion years old). Overall, the clusters here, most of them associated with the Sagittarius-Carina arm, are relatively young and compact, with a median age of 153 million years and a median diameter of 3.3 parsecs. Because there is relatively little obscuring dust behind us in the galactic rotation we can see great distances along the SC arm, from its nearest point at l = 350� to the Carina Nebula at l = 350�, an estimated 2300 parsecs away. This creates a remarkable visual transition in the stellar texture of the central Milky Way as the background stars gradually become fainter and more closely packed. There is also a noticeable color transition from the creamy yellow color of stars in the Sagittarius star cloud to the blue stars in Carina. Because spiral arms consist mostly of empty space we can readily see through them, which means we see parts of the Scutum-Crux arm through the Sagittarius arm, and this arm consists of a relatively dense population of older, yellow solar type stars, in contrast to the content of the Sagittarius arm, which is skewed toward star forming regions and the young, bluish stars associated with them. A final point of contrast is the large number of globular clusters concentrated in this part of the Milky Way. The key diagram shows only a portion of the total number within this area, but enough to illustrate how Harlow Shapley was able to use them to deduce the approximate location of the galactic barycenter. The Local Arm (l = 45� to 180�). Although visually much darker than the central Galaxy, this section of the Milky Way is perhaps the most dramatic. Here we look toward the large scale structures nearest to the Sun: the star clusters and dark clouds associated with the Local Arm (sometimes called the Orion arm) sweeping ahead of us in galactic rotation.
Place cursor over image for key. Click HERE for explanatory text with the full sized image (1500x701 pixels, 356Kb)
The most remarkable fact about the Local Arm is that after a century of astronomical study its limits, structure and content are still unclear. Originally believed to be a minor spur extending from the Sagittarius-Carina arm at a pitch angle of perhaps 25�, it has recently been described as a massive "crossing" structure that pierces the Perseus arm to connect with infalling matter from Quadrant III, as a massive "interarm" structure concentric with the Perseus arm at a pitch angle of around 14� � or as an illusion produced by windows through obscuring clouds along lines of sight toward l =60� and 240�. For purposes of illustration, the angular profile of the Local Arm and its thinner gas disk have been projected in the key diagram (mouseover, above) according to the V�zquez & alia "crossing" or Orion arm conception of the structure (yellow contours in the diagram, above right), assuming a thin disk height of 350 parsecs and a width of about 800 parsecs, and a gas disk height of 50 parsecs. The center of this hypothetical arm passes by the Sun at a near distance of about 600 parsecs (toward l = 150�), and continues into the Perseus arm at a pitch angle of about 30�. This places the Orion SFR at the trailing edge of the structure and the Sun in a void situated behind it. (The alternative Xu & alia "interarm" model is outlined in blue in the diagram above.) In either model, the long wall of obscuring giant molecular clouds appears to correspond to the concentrated dark lanes that are often visible in other galaxies along the "upstream" side of a spiral arm inside the spiral pattern corotation radius or in the "valley" between widely separated spiral arms. Depending on the model you prefer, the Sun appears to be located at or just inside the trailing boundary of this Local Arm (diagram, above right), so it is remarkable that the arm appears generally faint and broken to the naked eye. This is partly because we observe it through an enormous and turbulent screen of obscuring gas and dust, stretching in a continuous but tattered wall from Aquila through Taurus (mouseover image, above). However, it is also because the Local Arm is not a concentration of Solar type stars, like the Scutum-Crux arm: it is instead a loose aggregation of dark clouds, star forming regions and the young stars and star clusters that indicate recent star forming activity. The thin disk projection of this arm suggests that the visual Milky Way should enlarge and brighten considerably up to a maximum around l = 150�, but the extent of Milky Way stellar brightness does not follow this contour (even along the lower edge where obscuration is minimal). This indicates the lack of naked eye evidence for a large scale and nearby structure. Instead, there is obviously an increase in stellar density in the direction of Cepheus and into Cygnus, including the Cygnus star cloud. Most models of the Local Arm place its origin or vanishing point within the Summer Triangle. The downward curve of the distant Cygnus clouds allows us an unimpeded and nearly lengthwise view through the Local Arm contents at distances of over 2000 parsecs � more than twice the distance of the near point of the Sagittarius-Carina arm. This foreshortened view of the Local Arm appears to the naked eye as the Cygnus star cloud. This feature, stretching from β to γ Cygni (Albireo to Sadr), is among the most beautiful telescopic star fields in the Galaxy, spangled with bright, closely spaced stars, many double stars, and several extended H II regions including NGC 7000, the "North America" nebula. The turbulence wihin the curtain of dark clouds is apparent in its undulating profile, which originates below the galactic equator in Cygnus, then sweeps upward in tendrils that reach above the galactic equator in Cepheus and Cassiopeia (and extend from Cepheus as far as Polaris), and finally plunges below the equator again in Taurus. As we look into higher galactic longitudes we observe clouds that are closer to the Sun, from the Cygnus rift at 2500 parsecs to the nearby Taurus-Auriga SFR only 140 parsecs away. The large Northern Rift between galactic longitudes l = 140� to 160�, like the Aquila Rift, is dense enough and close enough (~250 pc) to produce a drop in the number of visible open star clusters (about 750 are catalogued within this third of the Milky Way panorama). Beyond these clouds lie the star forming regions of the Local Arm and, because spiral arms consist almost entirely of empty space, we can see through the Local Arm to the farther Perseus arm. Indeed, some of the best known star clusters in this direction � the Double Cluster NGC 884/869 (h & χ Persei), NGC 2099 (M 37) and NGC 1912 (M 38) � are located at the distance of the Perseus arm, well beyond any boundaries that have been proposed to define the Local Arm. The Local Arm experienced a burst of star forming activity about 3 billion years ago, and it has remained one of the most active regions of the Galaxy visible to us, with recent or ongoing star formation in Cygnus, Cepheus, Cassiopeia and Taurus, and many galactic bubbles, radio sources, planetary nebulae and expanding gas fragments that indicate several recent nova and supernova explosions (including those observed in 1054, 1572 and 1604). The Trailing Galaxy (l = 155� to 290�). This last section of the Milky Way panorama provides some of the greatest contrasts of any � from the brilliant Orion star forming region to the far Carina nebula and the dim, distant limits of the Local and Perseus spiral arms as these features extend into the outer limits of the Galaxy disk (diagram, right). From l = 180� we look "upstream" into the Milky Way: all matter we can observe is both outside the Solar circle and behind us in galactic rotation.
Place cursor over image for key. Click HERE for explanatory text with the full sized image (1500x701 pixels, 356Kb)
As in the other two panorama sections, the Vall�e consensus model has provided the toy spiral arms used to calculate the distance of the Carina tangent and the visual extent of the Perseus spiral arm. Following V�zquez & alia (2008), the Local Arm has been depicted as a "crossing" structure passing about 630 parsecs ahead of the Sun and extending through the Perseus arm toward a point around l = 230�. Beyond that longitude the nearest spiral structure is over 4600 parsecs away and hidden in a faint scatter of far stars and gas, much of it hidden behind Vela Molecular Ridge. The galactic band from l = 160� to 230� has the largest number of bright stars of any part of the Milky Way, including the spectacular asterisms of the Hyades, Pleiades, Auriga, Gemini, Orion and Canis Major. In addition, the wide area centered on l = 240� (known as the FitzGerald Window) comprises a dense concentration of naked eye stars and open star clusters that is visually suggestive of the Local Arm receding in space. (There are 720 clusters catalogued across this span of the Milky Way.) Because the density of obscuring interstellar medium is extremely low in this direction, we can observe in the visual to great distances � the young (133 million year old) open cluster NGC 2354 is almost 4100 parsecs away. Note that there are very few globular clusters in this direction, as these tend to be concentrated around the galactic nucleus. The major structural contrasts are evident in the key image (mouseover, above): the obscuring clouds of dust and gas thin considerably between the nearby Taurus and Orion SFRs (from 140 to 400 parsecs distant) and the Vela molecular ridge (700 parsecs distant). As a result there are few large H II regions in proportion to the many galactic star clusters, which are also spread vertically across a larger area of galactic latitude. In fact, the galactic span between l = 215� to 255� contains the most open star clusters of any part of the Milky Way, with particular concentrations around galactic longitudes l = 205� (mostly associated with the Orion star formation complex), l = 240� (our line of sight along the receding Local Arm) and 285� (our line of sight into the tangent of the Sagittarius-Carina Arm). With an average age of 705 million years and an average distance of 2550 parsecs, these are among the oldest, faintest and most distant star clusters visible. Due to their age and their orbits in a relatively sparse part of the Galaxy where they will be rarely disrupted by near encounters with giant molecular clouds, they are also among the largest galactic clusters, with an average radius of almost 3.2 parsecs. This is perhaps the least understood section of the Milky Way. There are substantial infalls of matter from this direction, organized into three spiral like features, one of them clearly the continuation of the Sagittarius-Carina arm, another perhaps a continuation of the Perseus arm, and a third very large feature outside the Perseus extension. The infalling matter from this third feature becomes fragmented into many large clouds which seem to shear across the Perseus arm and continue on a trajectory that is approximately aligned with the Local Arm (l = 240� to 260�). But one difficulty in tracing the outward extent of the Local Arm is that the galactic content outside the Solar circle rapidly becomes less concentrated and more fragmented with distance. The Local Arm thin disk and gas disk profiles continue the "crossing" Local Arm model adopted in the previous panorama, but objects that clearly trace a spiral structure into Quadrant IV are few and widely scattered in space. The ongoing Reid & alia survey of distant star forming regions with wide baseline interferometry will survey this area in the future, and may provide clarity on structures that so far have been obscured by ambiguous distance estimates. The Radio Panorama. [DRAFT] A very useful picture of these dark clouds � the origin structures of star formation � is available from the microwave survey of the Galaxy in the 2.6 cm emission wavelength of carbon monoxide (CO), which is a reliable indicator of the extent and density of giant clouds of molecular hydrogen (H2) and dust � the "origin structures" where star formation occurs. I've adapted the Galactic CO survey map compiled by Dame, Hartmann & Thaddeus (2001) to include indicators of ionized hydrogen (H II) regions (in magenta), 20 nearby OB associations, and stars visible from Earth down to magnitude 4.5.
Click on the image for the full sized, labeled version (3500x670 pixels, 363Kb) The major star forming regions and their approximate distances from the Sun are: � Ophiuchus (125 parsecs) For comparison, the Galactic center is estimated to be at about 8300 parsecs, which is also the approximate distance of the Perseus spiral arm in the direction of Canis Major. The image divides into two sections at roughly Galactic longitudes l = 60� and 240�, angles indicated in the panorama Galaxy images (above) and marked on the CO map with vertical dotted lines. These define the direction of a line through the Sun that is roughly parallel with the trailing side of the Local Arm. The current direction of the Sun's Galactic orbit, the solar apex, is marked with a red cross, almost directly above the point where the Orion and Carina-Sagittarius arms of the Galaxy appear to converge. Thus the Sun is traveling behind and roughly parallel to the Local Arm. The section through l = 0� is the perspective of the Sun looking away from the Local Arm toward the Galaxy center. The gas mapped here is in the Sagittarius-Carina arm (nearest at l 314� and 900 parsecs distant), overlaid on the Scutum�Crux arm and the Galaxy central bar, which extends from our perspective out to l = 40� (see the Galaxy map, above). Between l = 50� and 60� we cannot look far into the likely juction of the Local Arm with the Sagittarius-Carina arm due to dense molecular and dust clouds, but we can see the root of the Local Arm in the Cygnus star field between β and γ Cygni. At many points between Cygnus and Canis Major we look through the Local Arm to the distant Perseus arm, about 1900 parsecs away at its closest point. This is visible mostly as open star clusters located within it: the Double Cluster in Perseus (NGC 869/884, ~2300 pc), NGC 1960 and 2099 in Auriga (1300-1400 pc), and NGC (1500 pc) in Canis Major. Notice that the entire Local Arm in the CO map appears to have an enlarged texture because we observe the molecular cloud turbulence from a distance of a few hundred parsecs. It is also disrupted by turbulence � fragmented and lifted above the Galactic plane. Although much of the Perseus arm in this direction is veiled by interstellar dust, the area just above the Galactic equator between zeta Aquilae and gamma Cygni has been described as the most glorious star field in the Milky Way. For southern hemisphere observers, a similar distant view is located in the opposite direction, around the Carina Nebula. The view in that direction is partly obscured by the closer Vela molecular ridge (at around 270�) associated with the Gum Nebula supernova remnant, but the star fields and associated Galactic clusters are equally spectacular. The opposite section of the CO map lies beyond the Sun in the direction of the Local Arm. The extensive shredding of gas and its displacement above and below the Galactic plane is evidence of the extreme turbulence created by the Local Arm spiral arm shock wave that the giant molecular clouds have traversed in the past several million years. The texture of the cloud boundaries also visually indicates their relative distances, with the Taurus-Auriga Complex lying much closer to us than the Orion or Cygnus complexes. Active star formation is occurring across the entire span of the Local Arm, but is especially concentrated in the Taurus and Orion clouds. Both these sites have been studied extensively with infrared and radio telescopes. The OB associations, as verified from Hipparcos parallax and proper motion data, are found at sites of recent star formation between 2.5 and 50 million years ago. These compose a ring of bright stars first noticed by John Herschel but known as the Gould Belt after American astronomer Benjamin Gould, who described it in his Uranometria Argentina (1897). I've also indicated the very extended Cassiopeia-Taurus association, estimated to be about 50 million years old, which is believed to consist of stars produced at the origin event of local star formation that, expanding outward in a series of cloud collapses, may have produced the Gould Belt. Further ReadingResearch papers and books are cited on this page by author last name and year of publication. Most of these references are available in .pdf format from the SAO/NASA Astrophysics Data System maintained at Harvard University, some of them linked below. To find specific articles, enter a single author last name and the year of publication in the search box; this is usually sufficient to retrieve a specific paper. (More complex queries seem to confuse the search engine.) Some papers require payment at proprietary publication servers; these can often be retrieved for free, as prepublication manuscripts, from arXiv.org maintained by the Cornell University Library. If that fails, copies of the document are sometimes put online by the author or his university, and can be found by searching for the full article title with Google. Books can often be found with Google Books. Astronomical Coordinate Systems (1920) by Hartmut Frommert � Overview of the technical definitions of the horizon, equatorial (celestial), ecliptical and galactic coordinate systems. "The Scale of the Universe" (1920) by H. Shapley & H. Curtis � The published summary of the "Great Debate" that illustrates the state of astronomical knowledge shortly after the turn of the 20th century. "The Galactic System as a Spiral Nebula" (1958) by J.H. Oort, F.T. Kerr & G. Westerhout � A review of then current research by the astronomers who provided the first radio map of galactic spiral structure. "Spiral Structure of the Galaxy Derived from the Hat Creek Survey of Neutral Hydrogen" (1970) by H. Weaver � an early use of radio astronomy to infer Galactic structure, with a helpful explanation of how the calculation of spiral structure is made. "A Model for the Local Spiral Structure of the Galaxy" (1976) by R.M. Humphreys � a classic summary and application of "young" tracers to identify Galaxy spiral arms. "The spiral structure of our Galaxy determined from H II regions" (1976) by Y.M. Georgelin & Y.P. Georgelin � a classic and frequently cited study of Galaxy spiral structure, based on H II tracers of star formation. "Kinematics of young stars. I. Local irregularities" (2000) by J. Torra, D. Fern�ndez & F. Figueras � Analysis of the kinematics of stars assumed to compose the Gould belt. "The Milky Way in Molecular Clouds: A New Complete CO Survey" (2001) by T.M. Dame, D. Hartmann & P. Thaddeus � presenting a comprehensive, high resolution map of H2 clouds combined from over 30 radio surveys of CO emission: a classic paper. "3D mapping of the dense interstellar gas around the Local Bubble" (2003) by R. Lallement, B.Y. Welsh, J.L. Vergely, F. Crifo & D. Sfeir � the contours of the circumsolar "bubble" deficient in cold, neutral gas is mapped out to 300 parsecs using absorption data from over 1000 stars. "The Gould Belt, star formation, and the local interstellar medium" (2004) by Isabelle Grenier � a useful summary of recent research on the Gould Belt, summarizing characteristics and origin theories. "Direct Determination of the Spiral Pattern Rotation Speed of the Galaxy" (2005) by W.S. Dias & J.R. L�pine � a recent survey of galactic star clusters as tracers of spiral arms and indicators of the pattern rotation of the arms (separate from the stars they contain). "The Warp and Spiral Arms of the Milky Way" (2006) by E.S. Levine, L. Blitz, C. Heiles & M. Weinberg � 21 cm radio observation of neutral hydrogen (H I) density is used to define the warp of the galactic disk and map the far spiral arms. "The spiral structure of our Milky Way Galaxy" (2009) by L.G. Hou, J.L. Han & W.B. Shi � a recent spiral arm study that exhaustively updates data on H II and H2 tracers, weighted by mass in the fit of 2, 3 and 4 arm spiral models (as usual, the 4 arm model wins). "Hierarchical star formation: stars and stellar clusters in the Gould Belt" (2009) by F. Elias, E.J. Alfaro & J. Cabrera-Cano � Analysis of the star clusters and star forming regions assumed to compose the Gould belt. "COBE and the Galactic Interstellar Medium: Geometry of the Spiral Arms from FIR Cooling Lines" (2010) by T.Y. Steiman-Cameron, M. Wolfire & D. Hollenbach � COBE/FIRAS measurements of C II and N II lines in the interstellar medium are used to identify four logarithmic spiral arms; the authors also review previous models and the effect of using "young" vs. "old" tracers. The Milky Way, Part I: Components of the MW (2012) by S. Trager � a basic overview of the galactic stellar populations. "The RMS survey: galactic distribution of massive star formation" (2014) by J.S. Urquhart, C.C. Figura, T.J.T. Moore, M.G. Hoare, S.L. Lumsden, J.C. Mottram, M.A. Thompson & R.D. Outmaijer � a new sample of 1750 massive YSOs and compact H II regions from the Red MSX (RMS) survey is used to describe galaxy structure, with substantial contribution to Quadrant IV. "The Formation and Early Evolution of Young Massive Clusters" (2014) by S.N. Longmore, J.M. Diederik Kruijssen, N. Bastian, J. Bally, J. Rathborne, L. Testi, A. Stolte, J. Dale, E. Bressert & J. Alves � an excellent review paper on the formation and qualitative variety of galactic globular clusters. "Trigonometric Parallaxes of High Mass Star Forming Regions: The Structure and Kinematics of the Milky Way" (2014) by M.J Reid, K.M. Menten, A. Brunthaler, X.W. Zheng, T.M. Dame, Y. Xu, B. Zhang, A. Sanna, M. Sato, K. Hachisuka, Y.K. Choi, K. Immer, L. Moscadelli, K.L.J. Rygi & A. Bartkiewicz � a short but groundbreaking paper that applies very long baseline interferometry to measure accurately the distance to spiral arm tracers and calculate the distance of the Sun from the Galaxy center. Last revised 10/06/14 � �2014 Bruce MacEvoy | ||||||||||||||||||||||||||||||||||||||||||||||||||||||||||||||||||||||||||||||||||||||||||||||||||||||||||||||||||||||||||||||||||||||||||||||||||||||||||||||||||||||||||||||||||||||||||||||||||||||||||||||||||||||||||||||||||||||||||||||||||
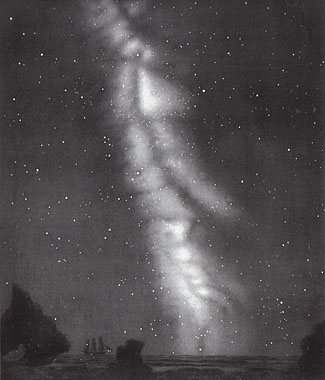
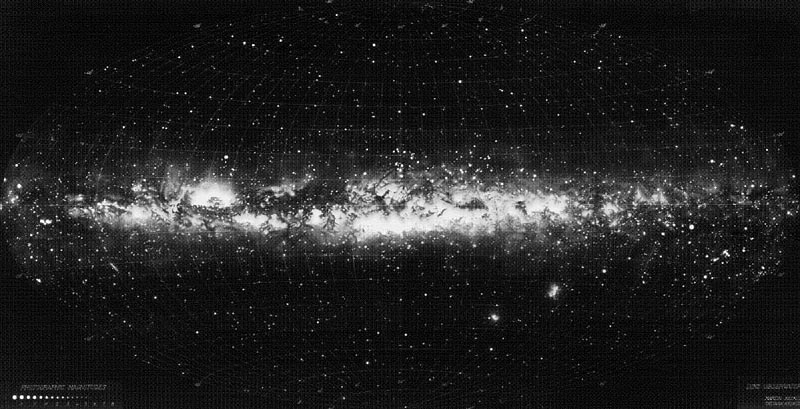
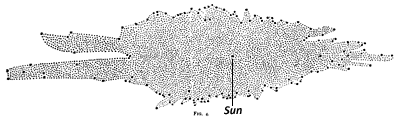
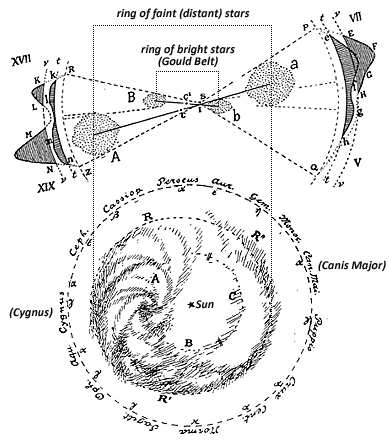
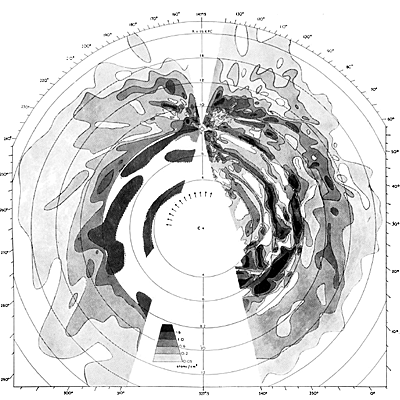
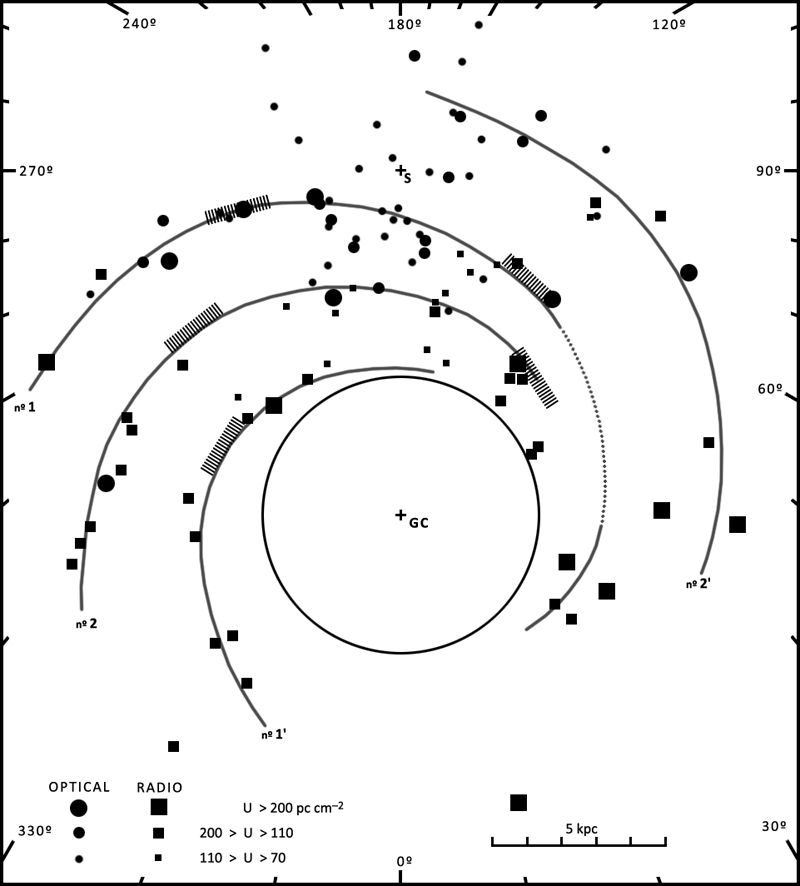
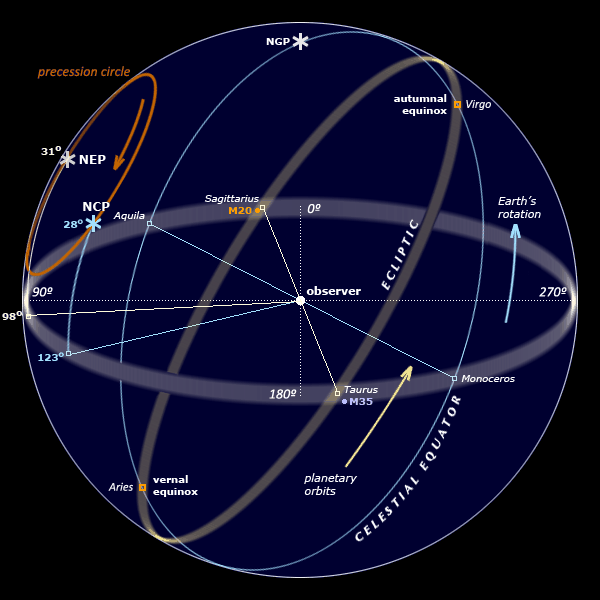
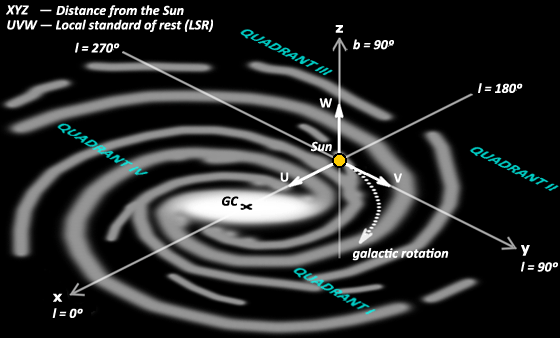
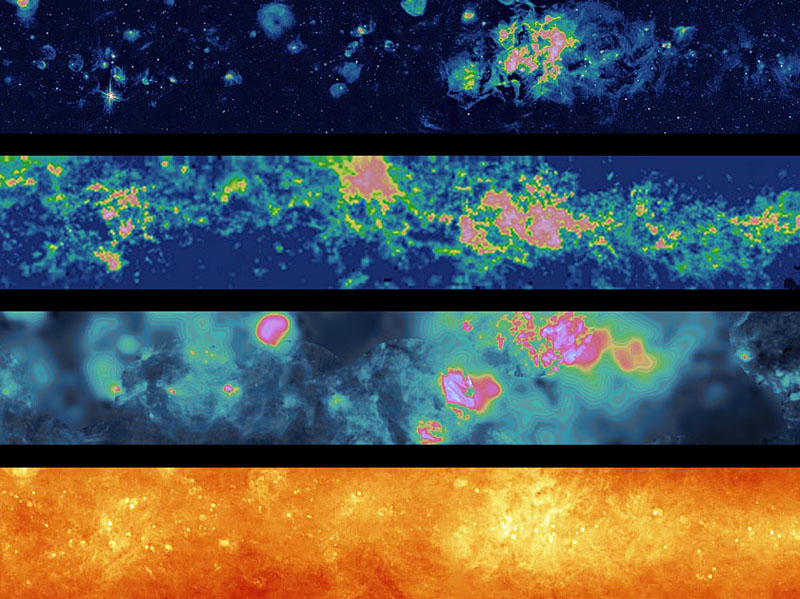
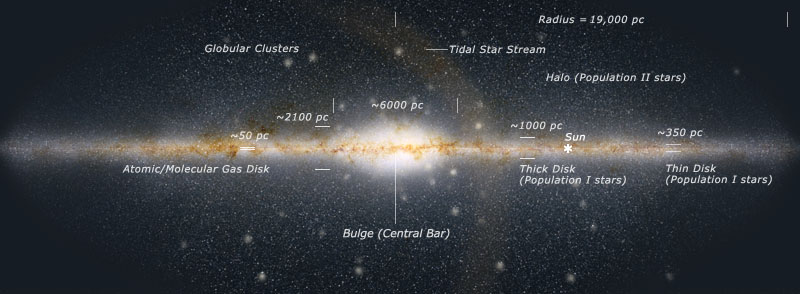
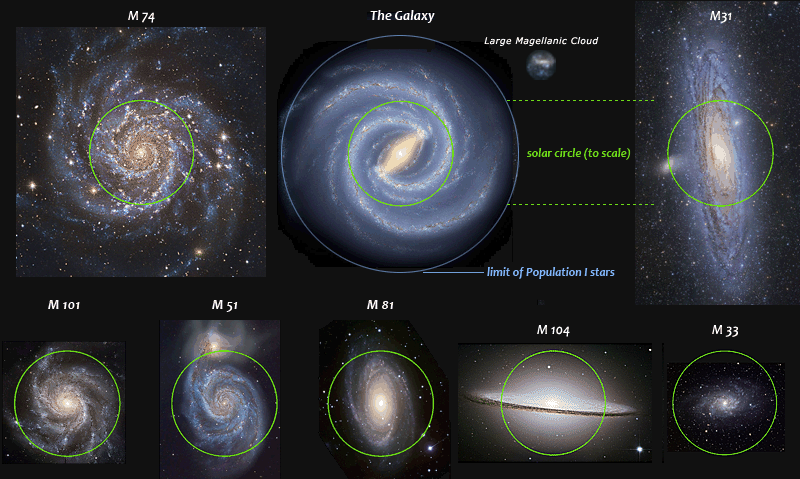
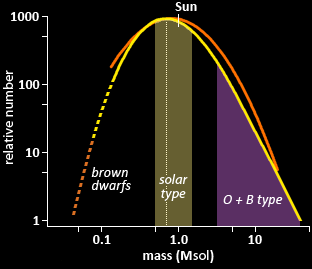
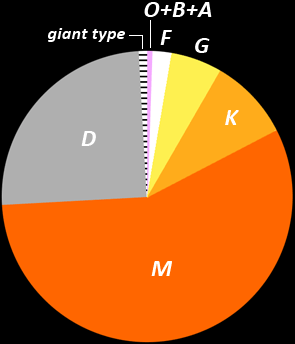
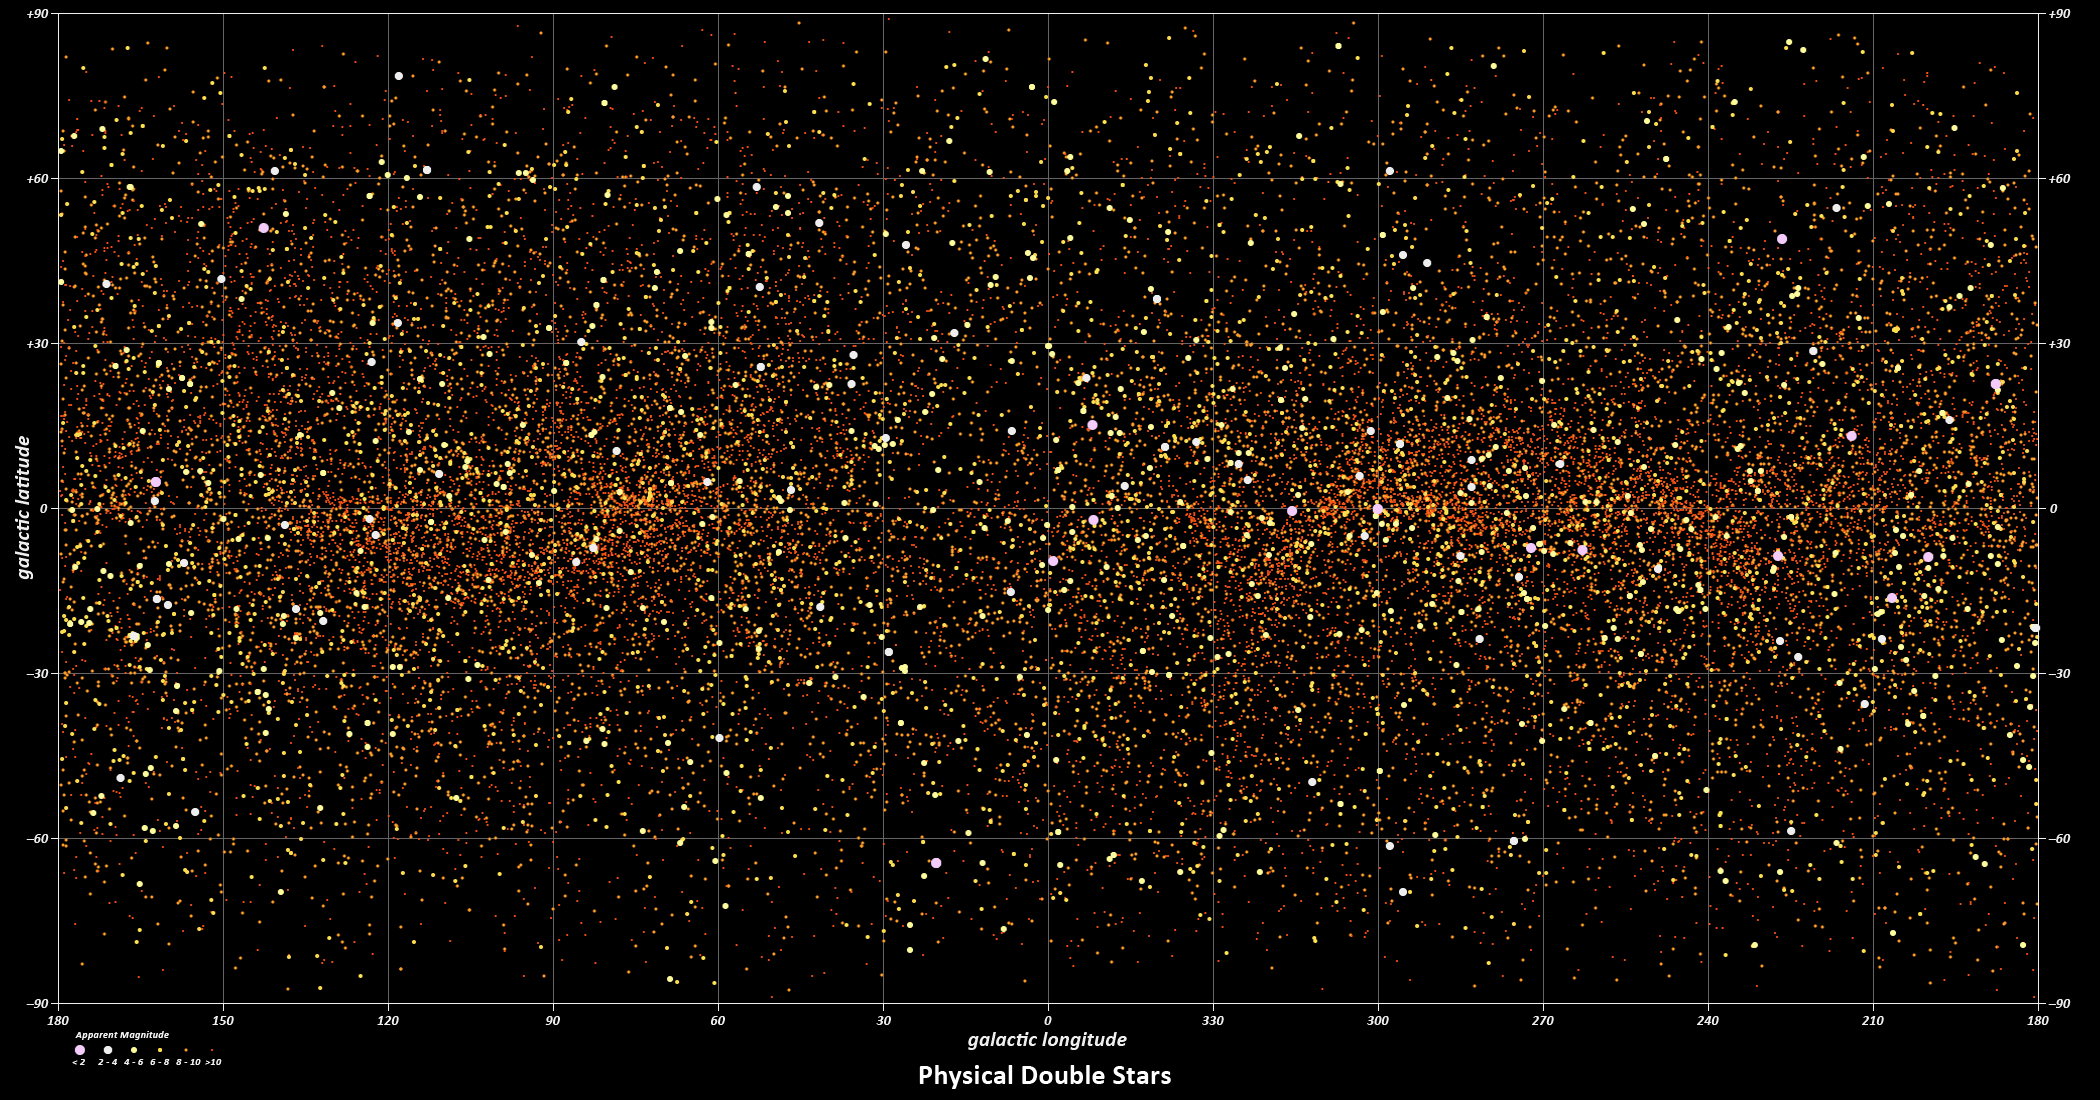
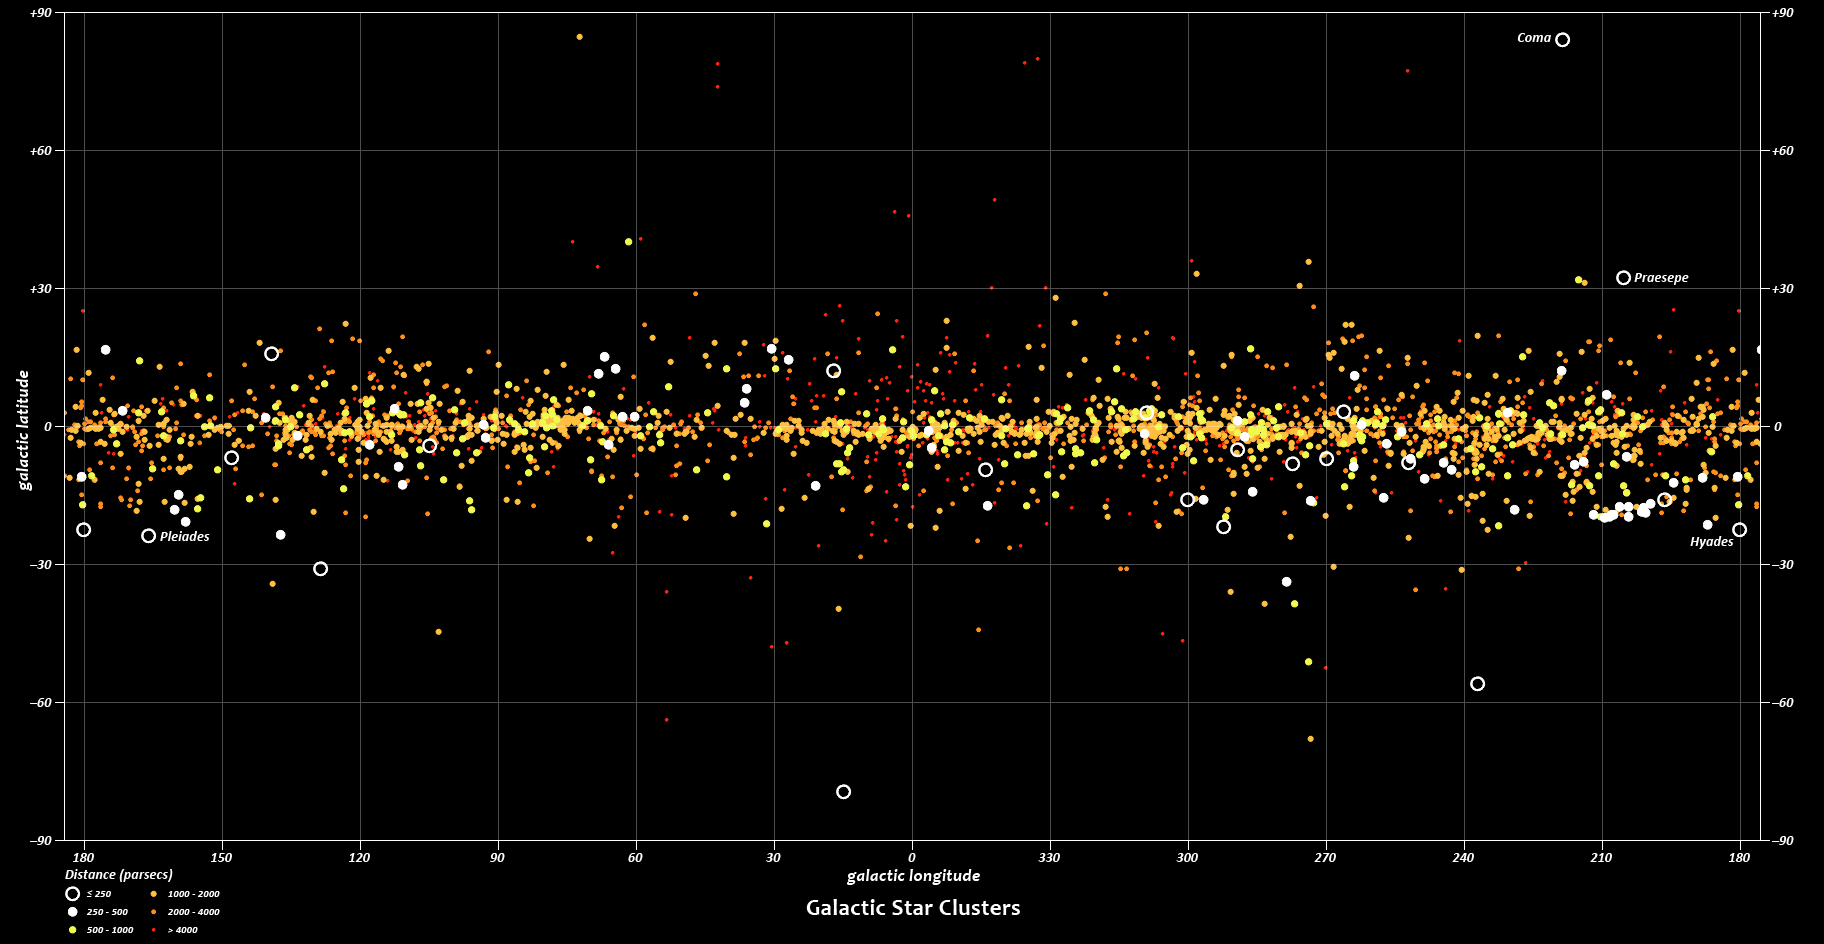
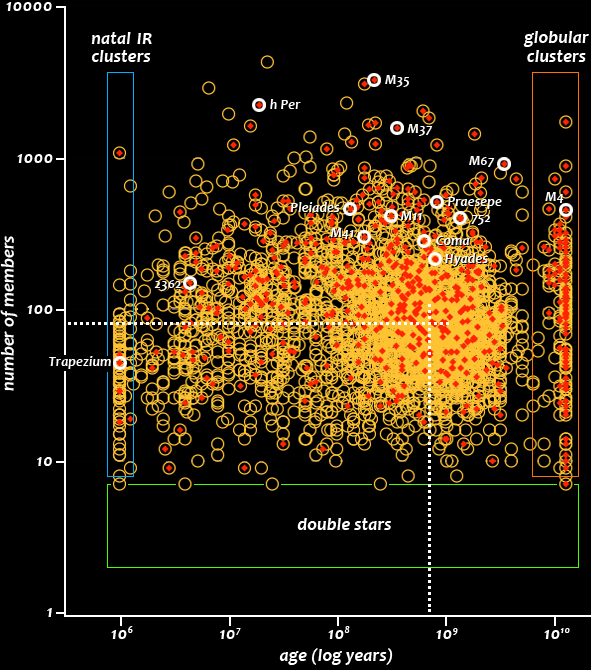
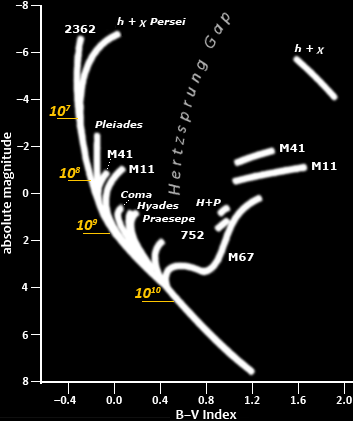
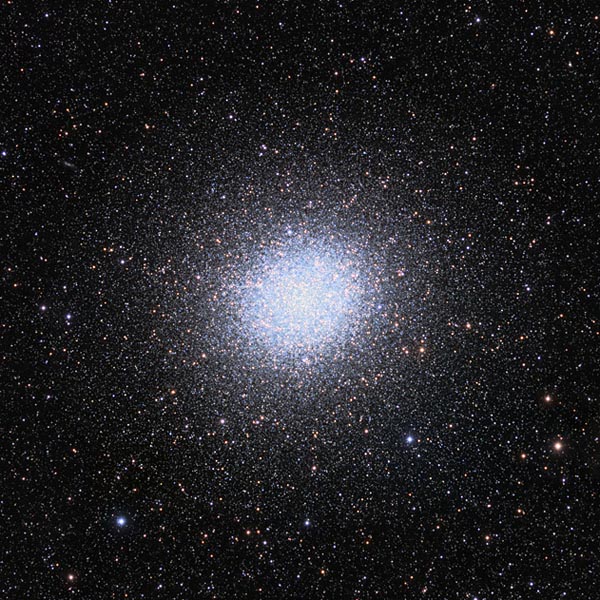
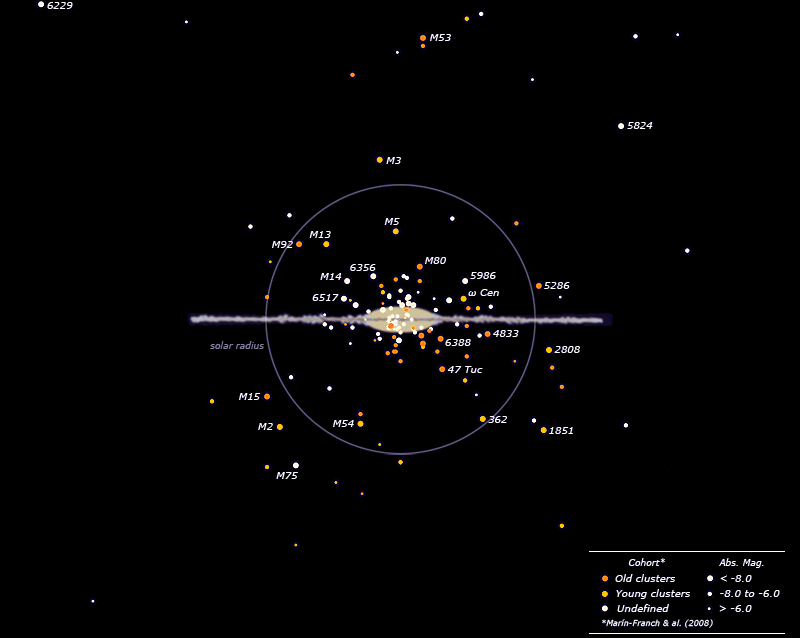
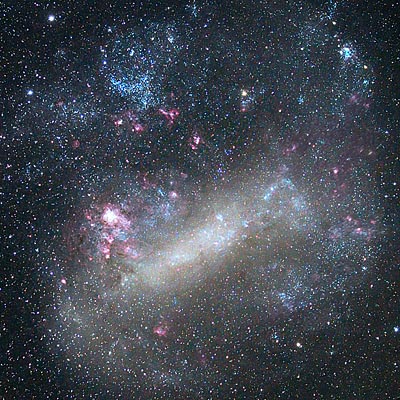
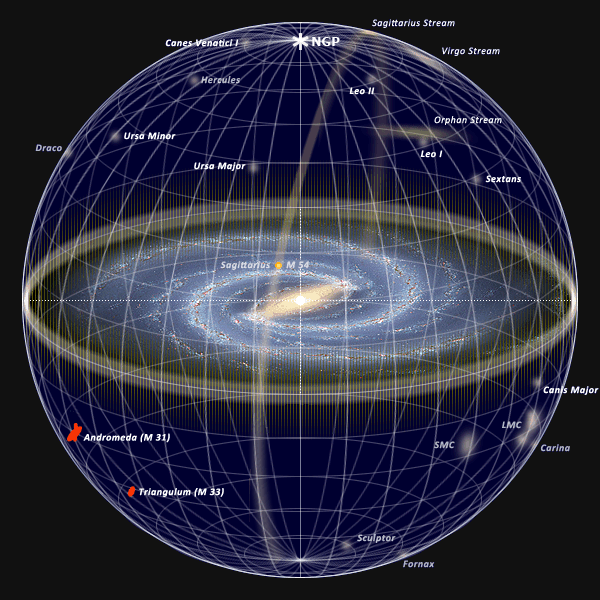
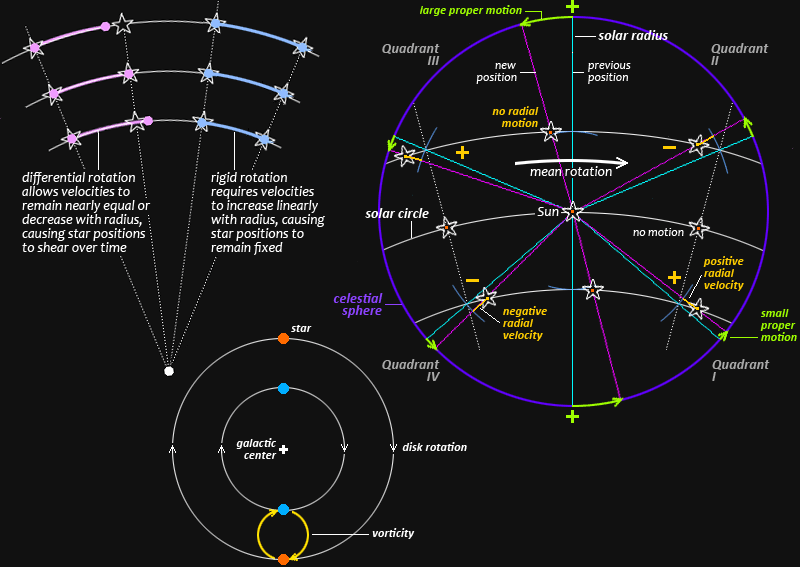
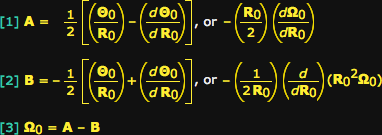
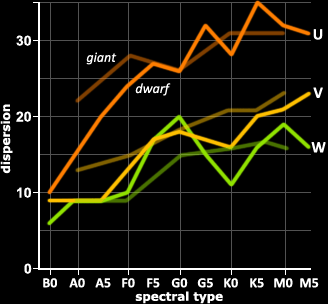
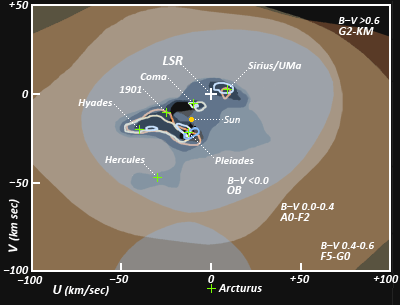
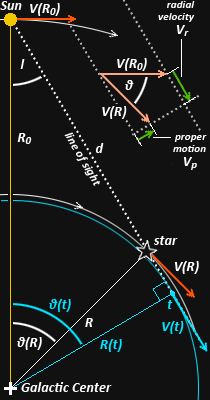

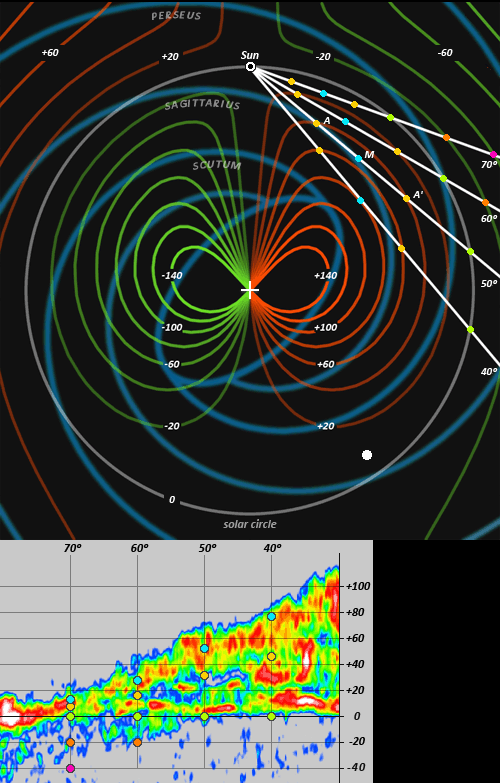
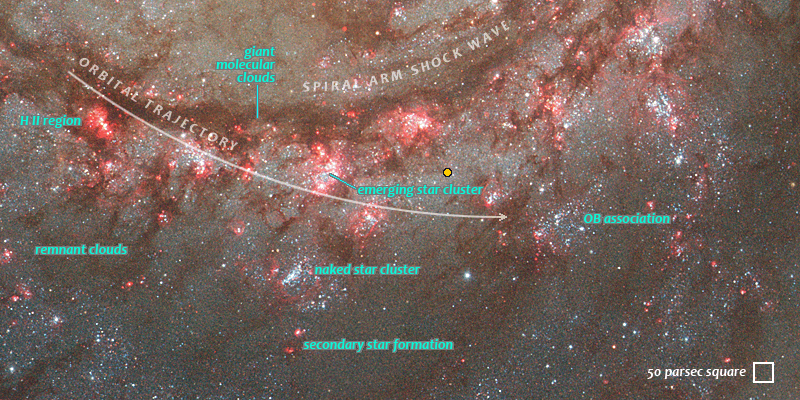
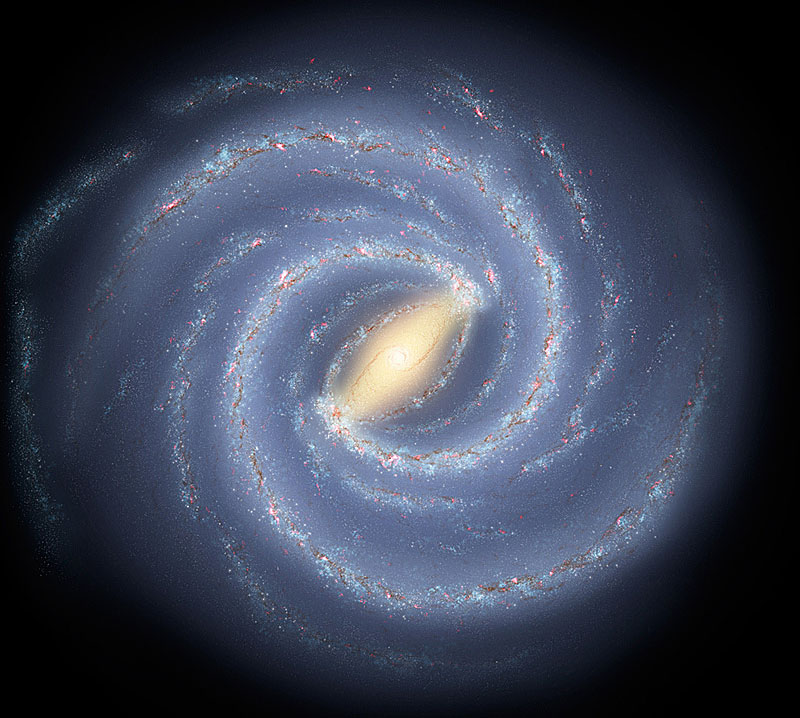
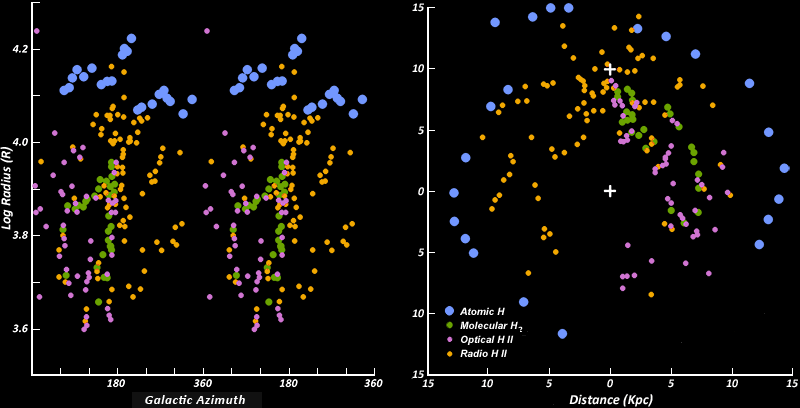
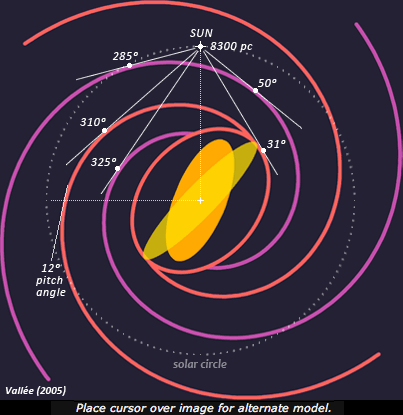
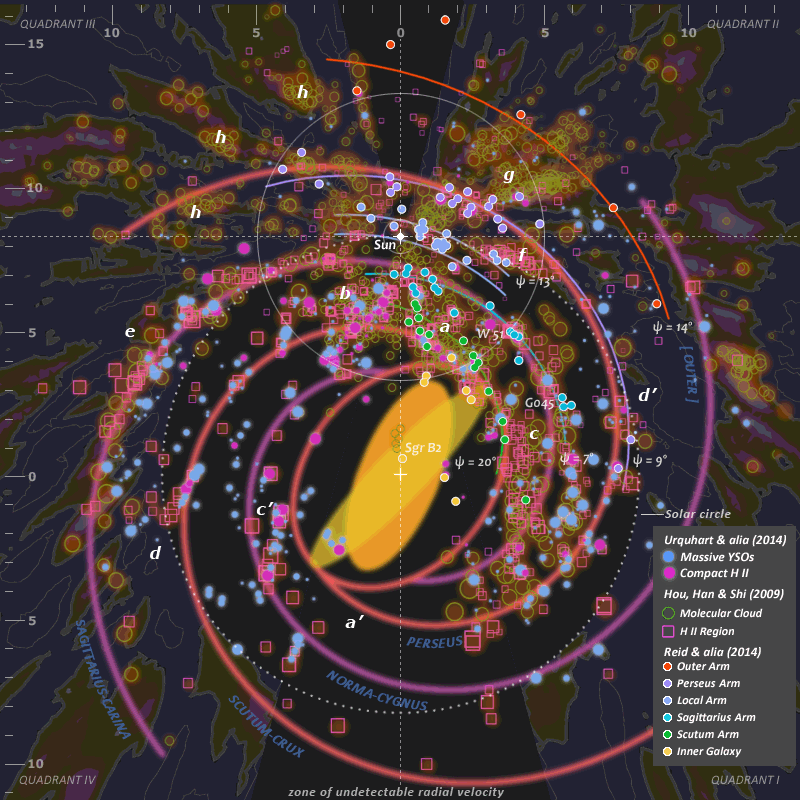
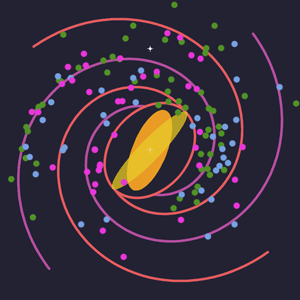
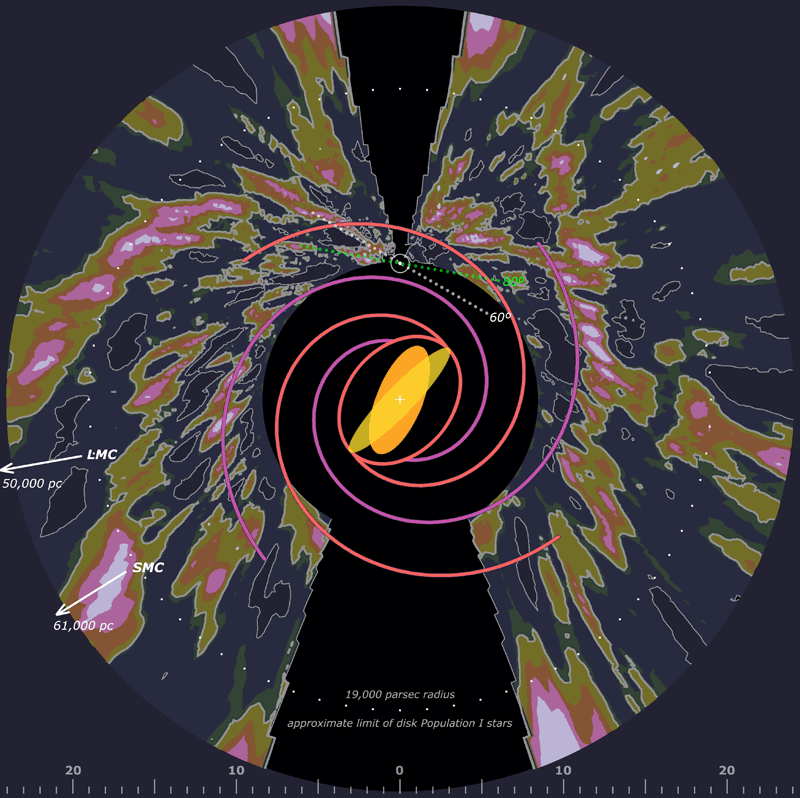
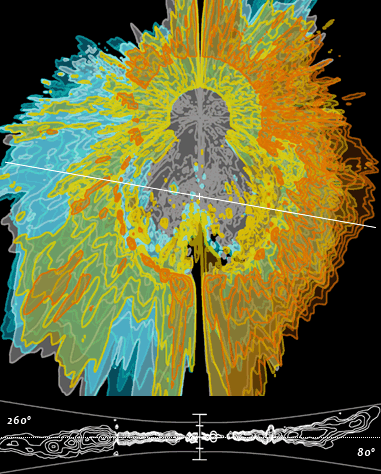
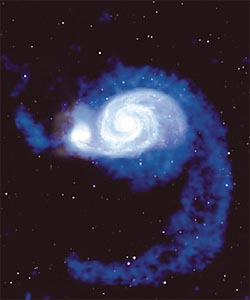
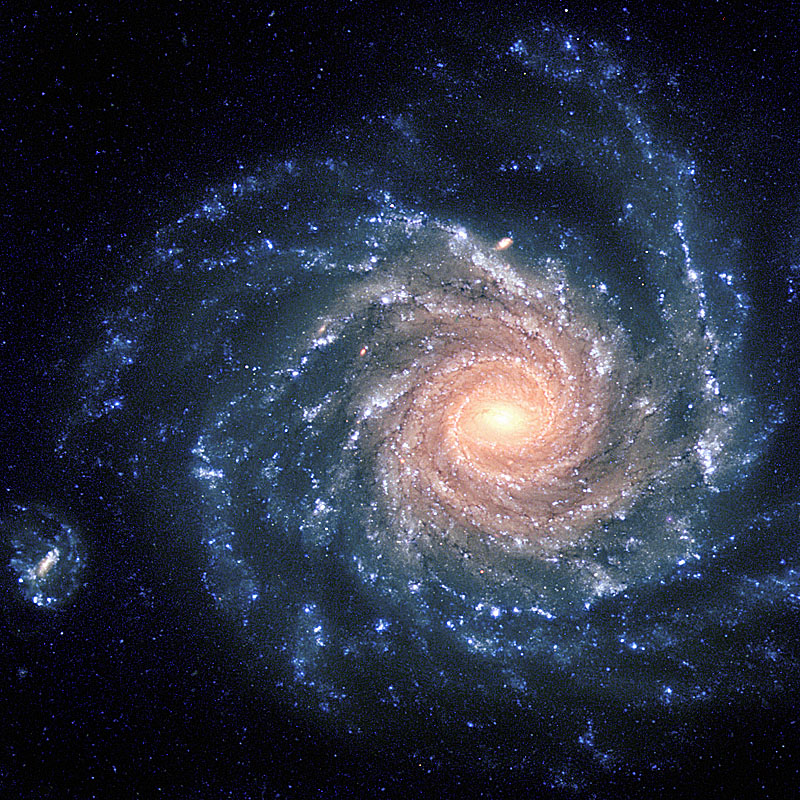
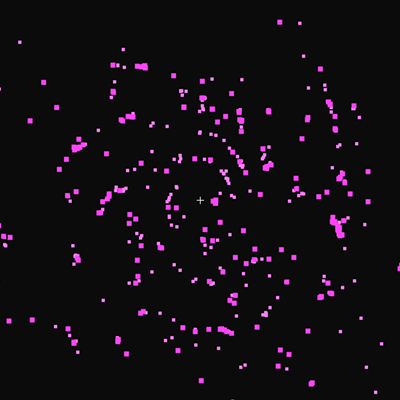
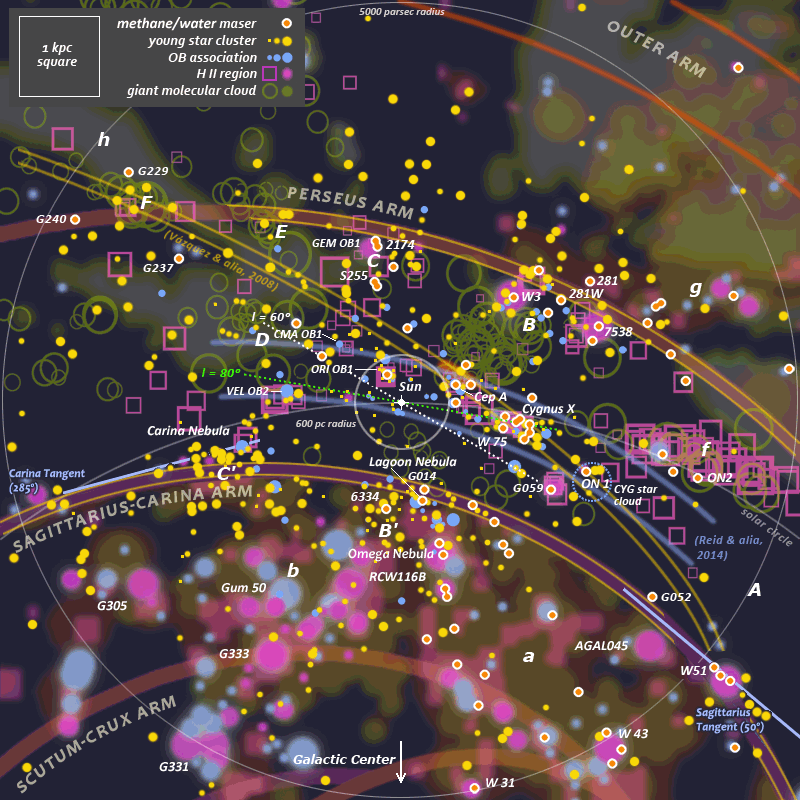
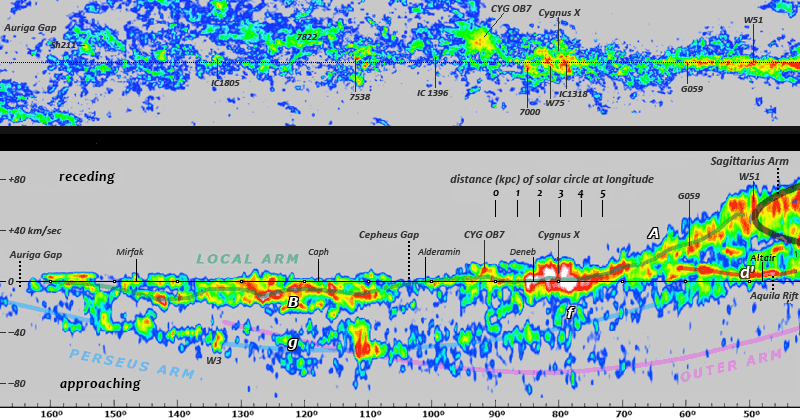
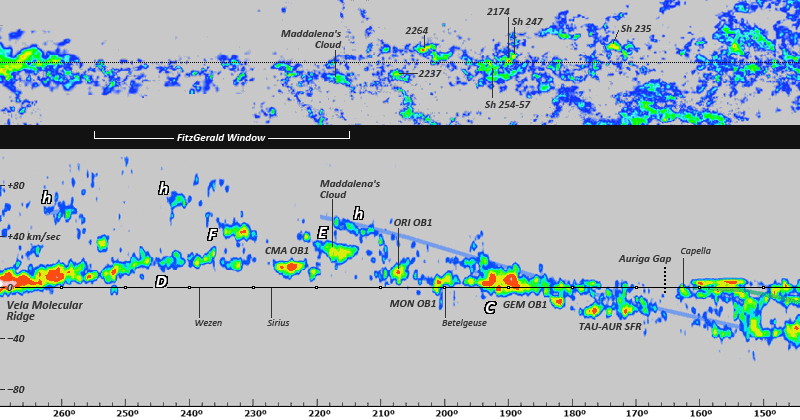
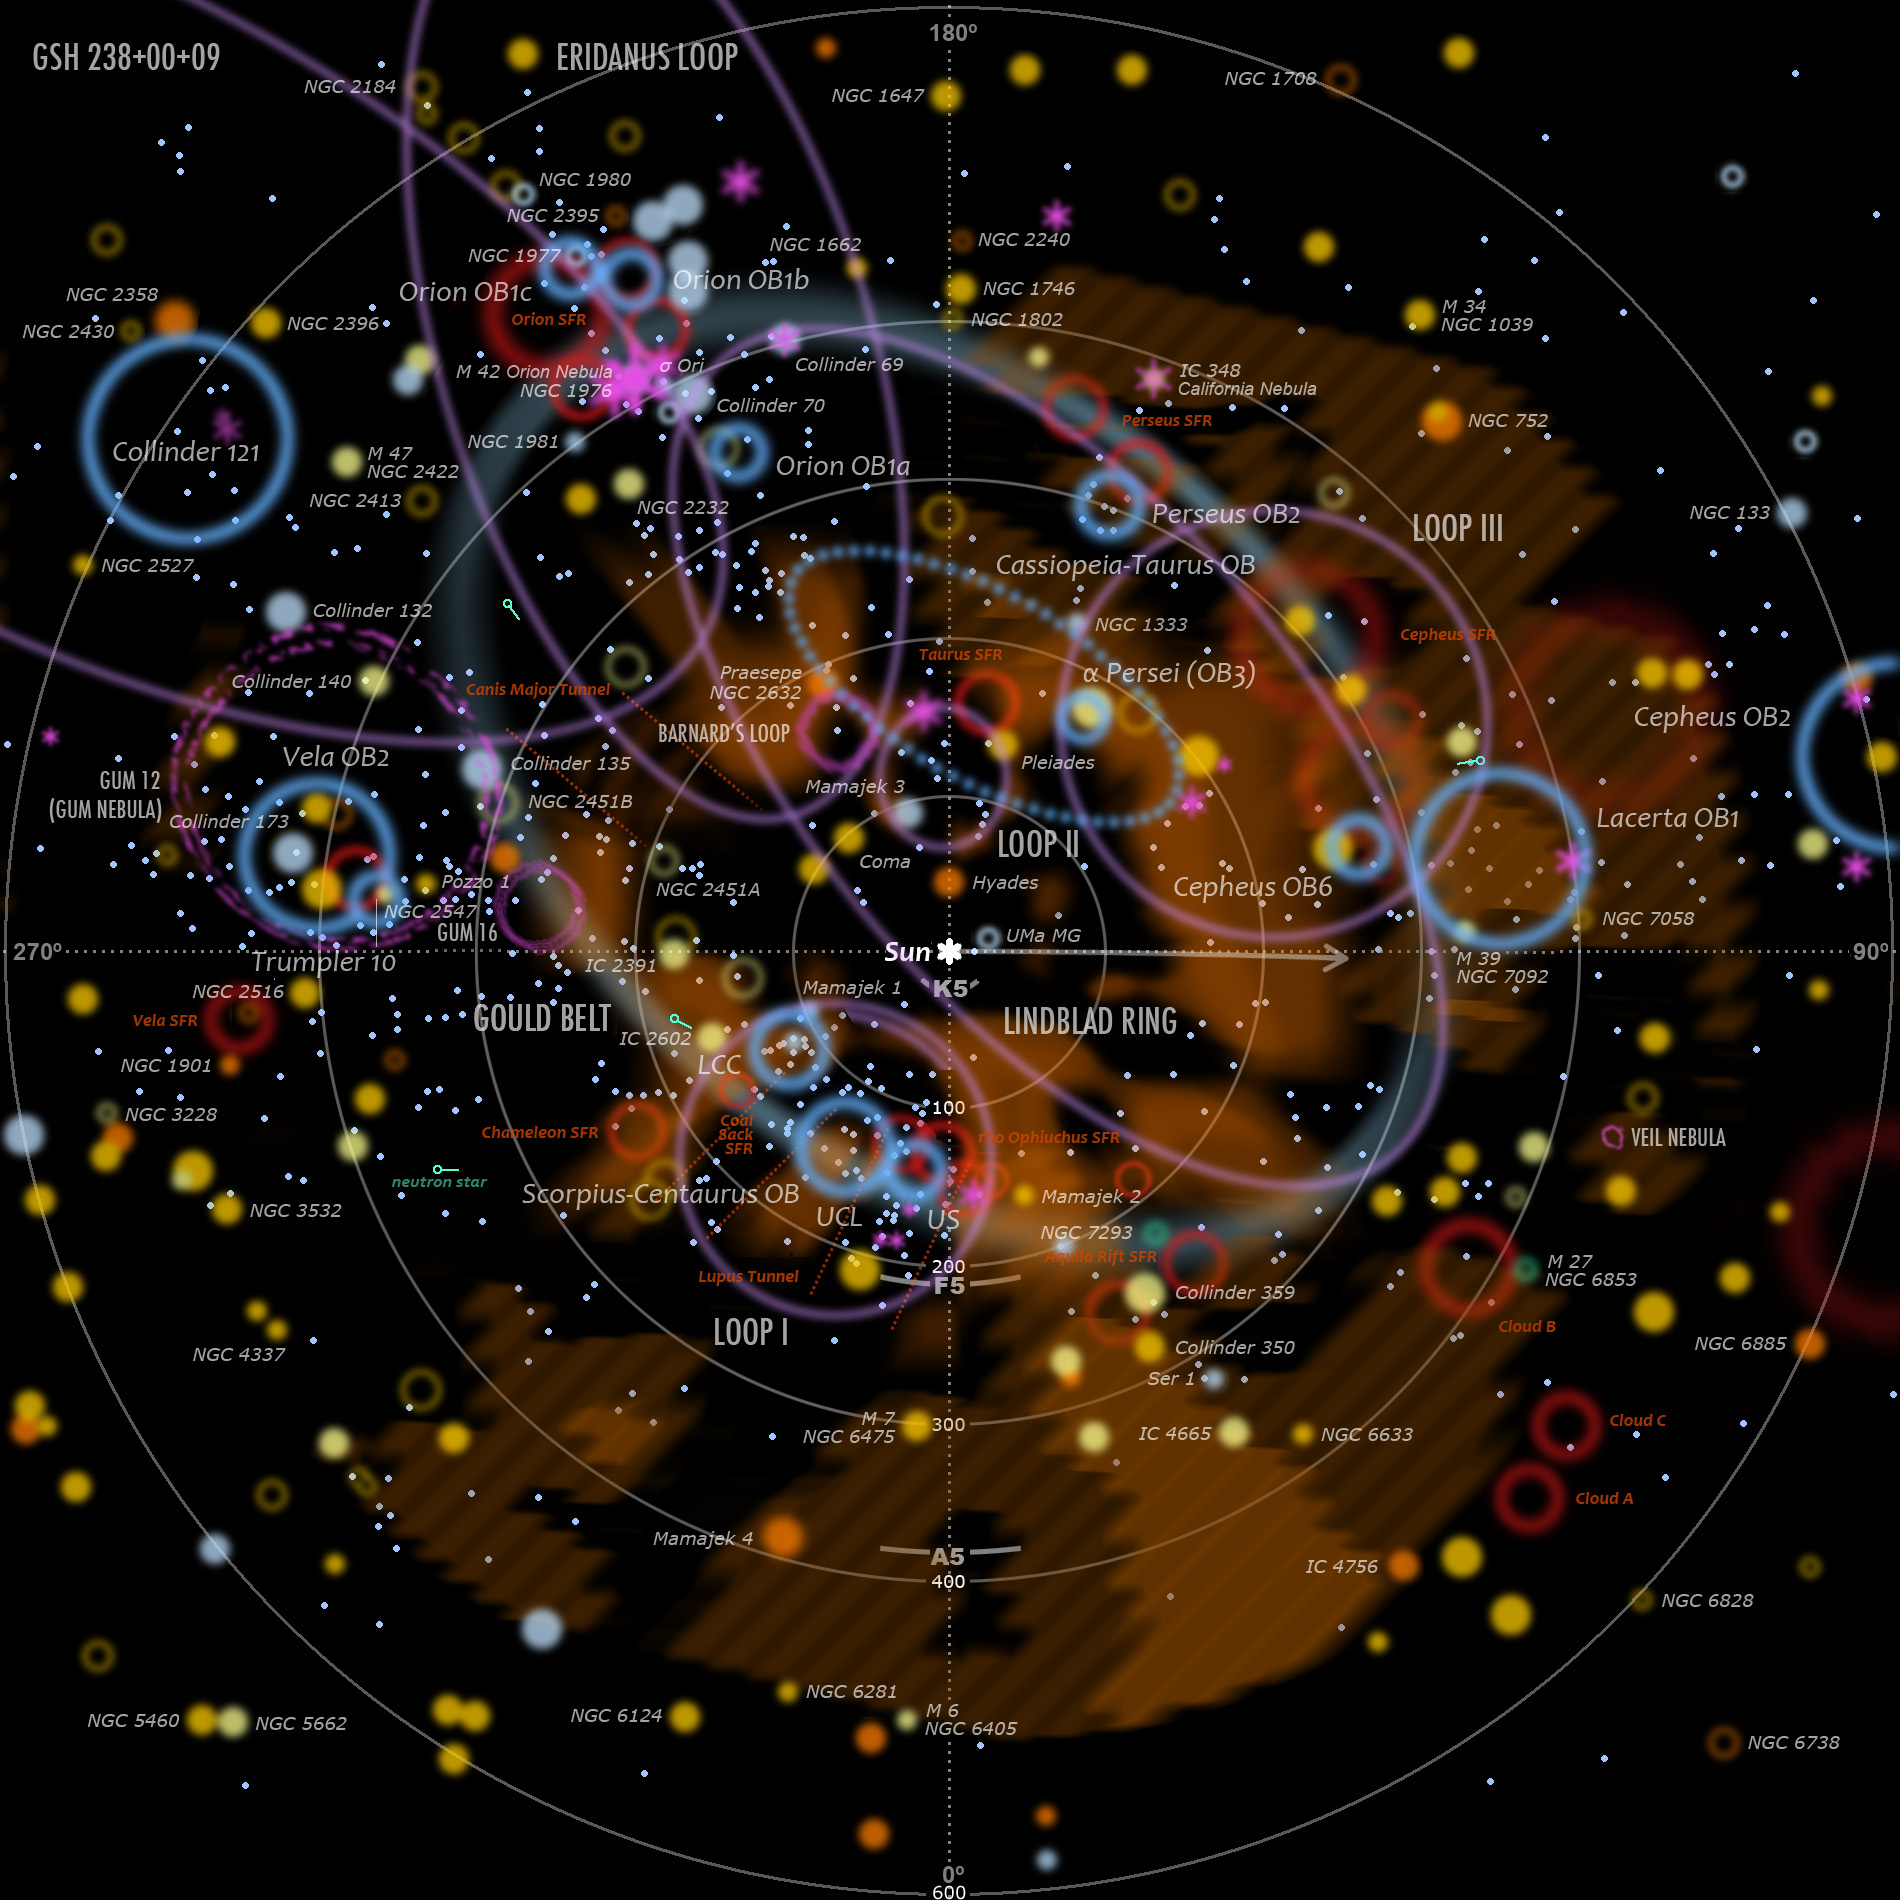
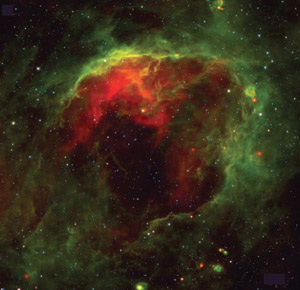


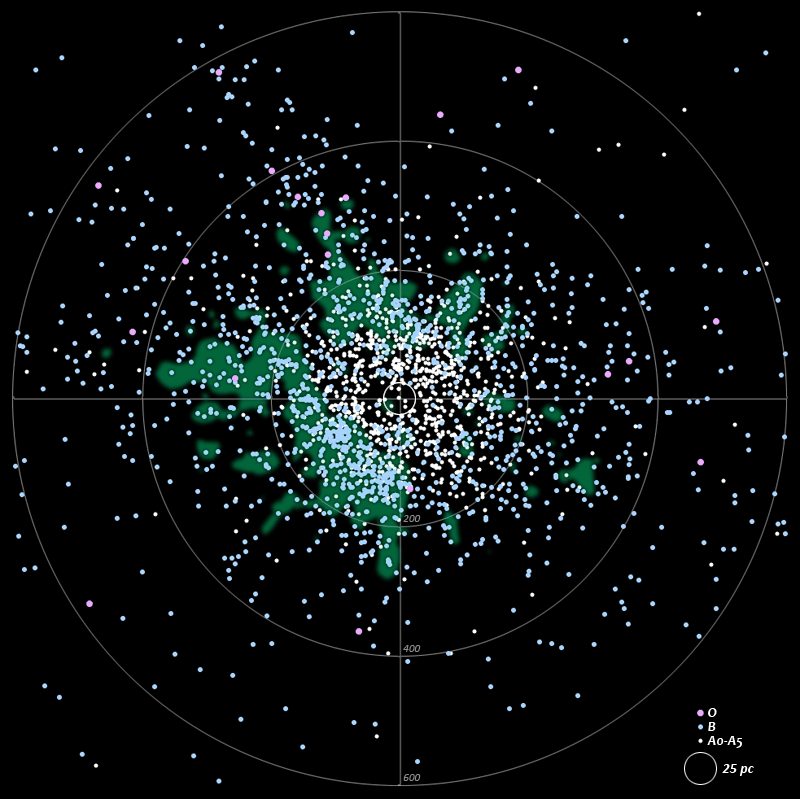
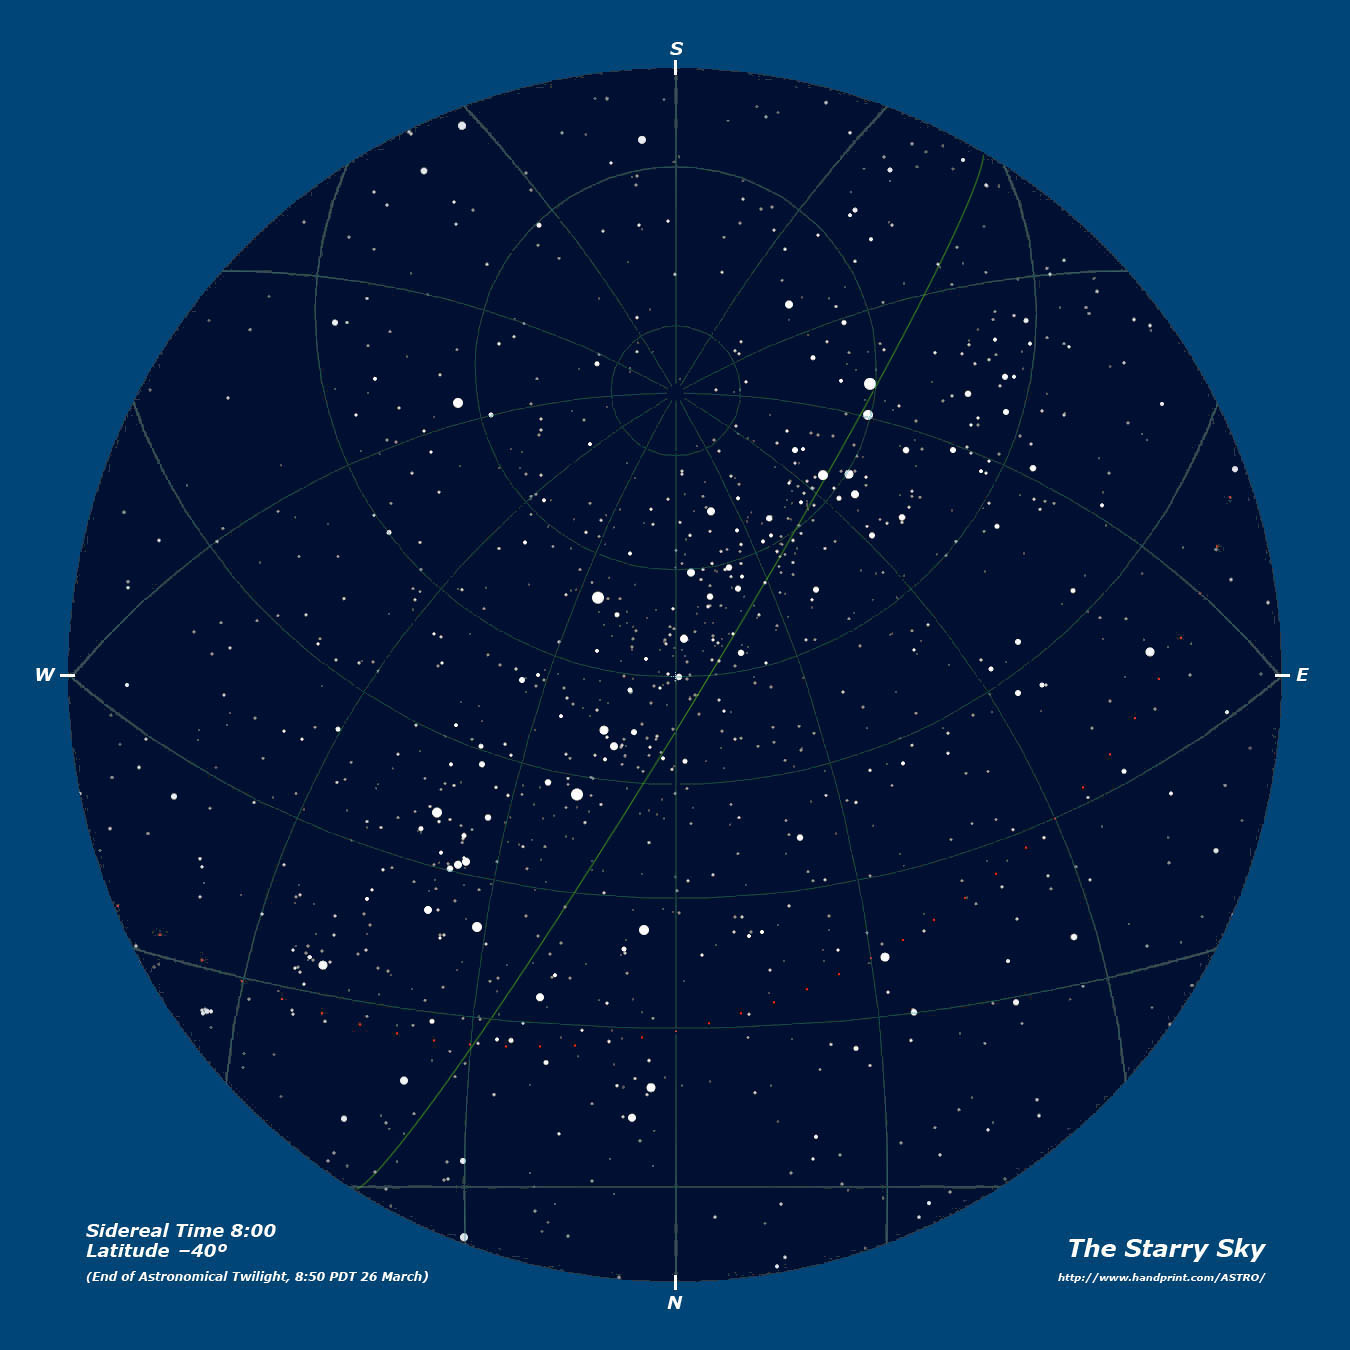
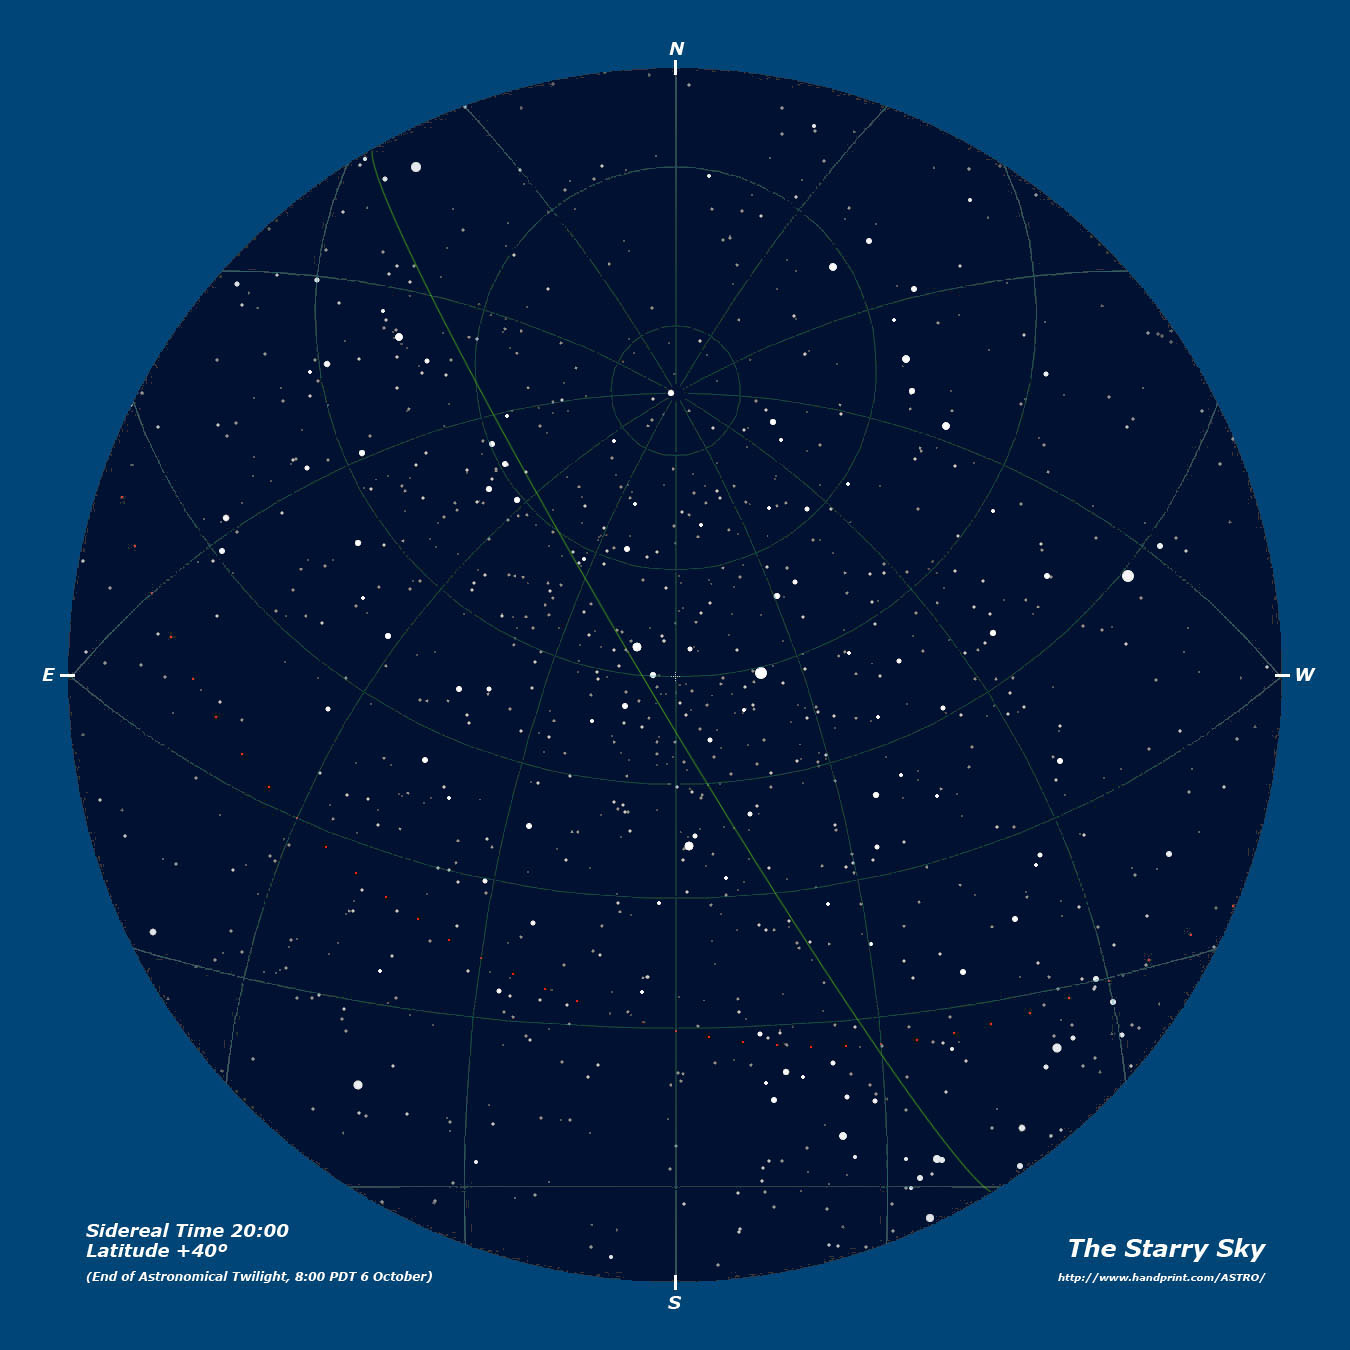

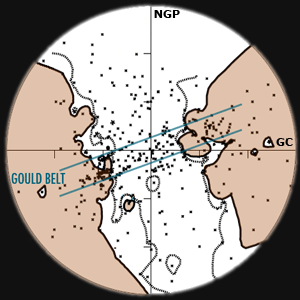
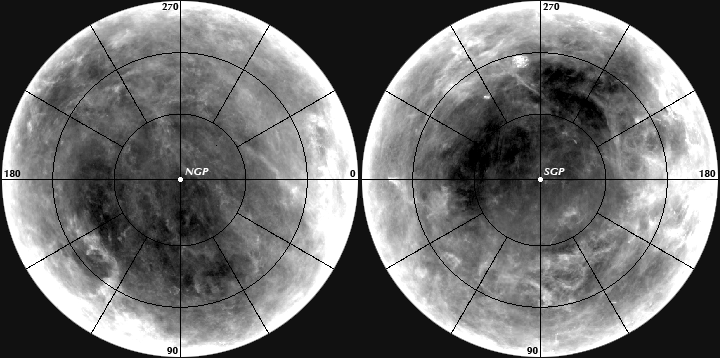
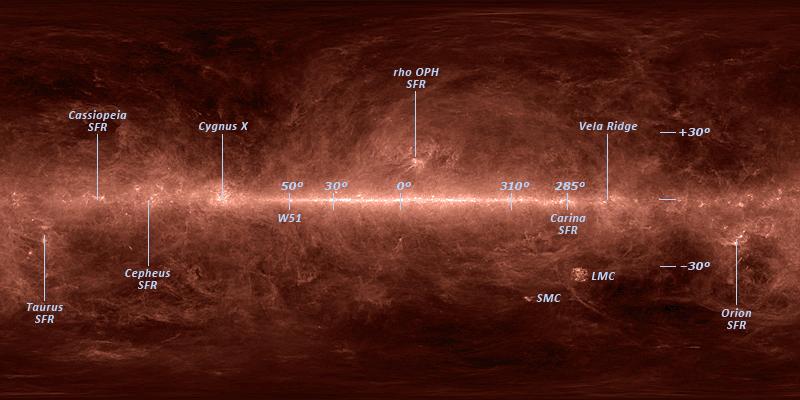
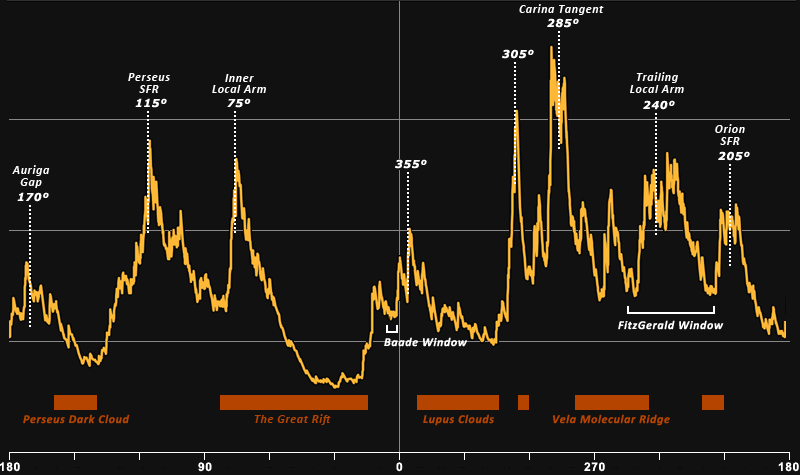
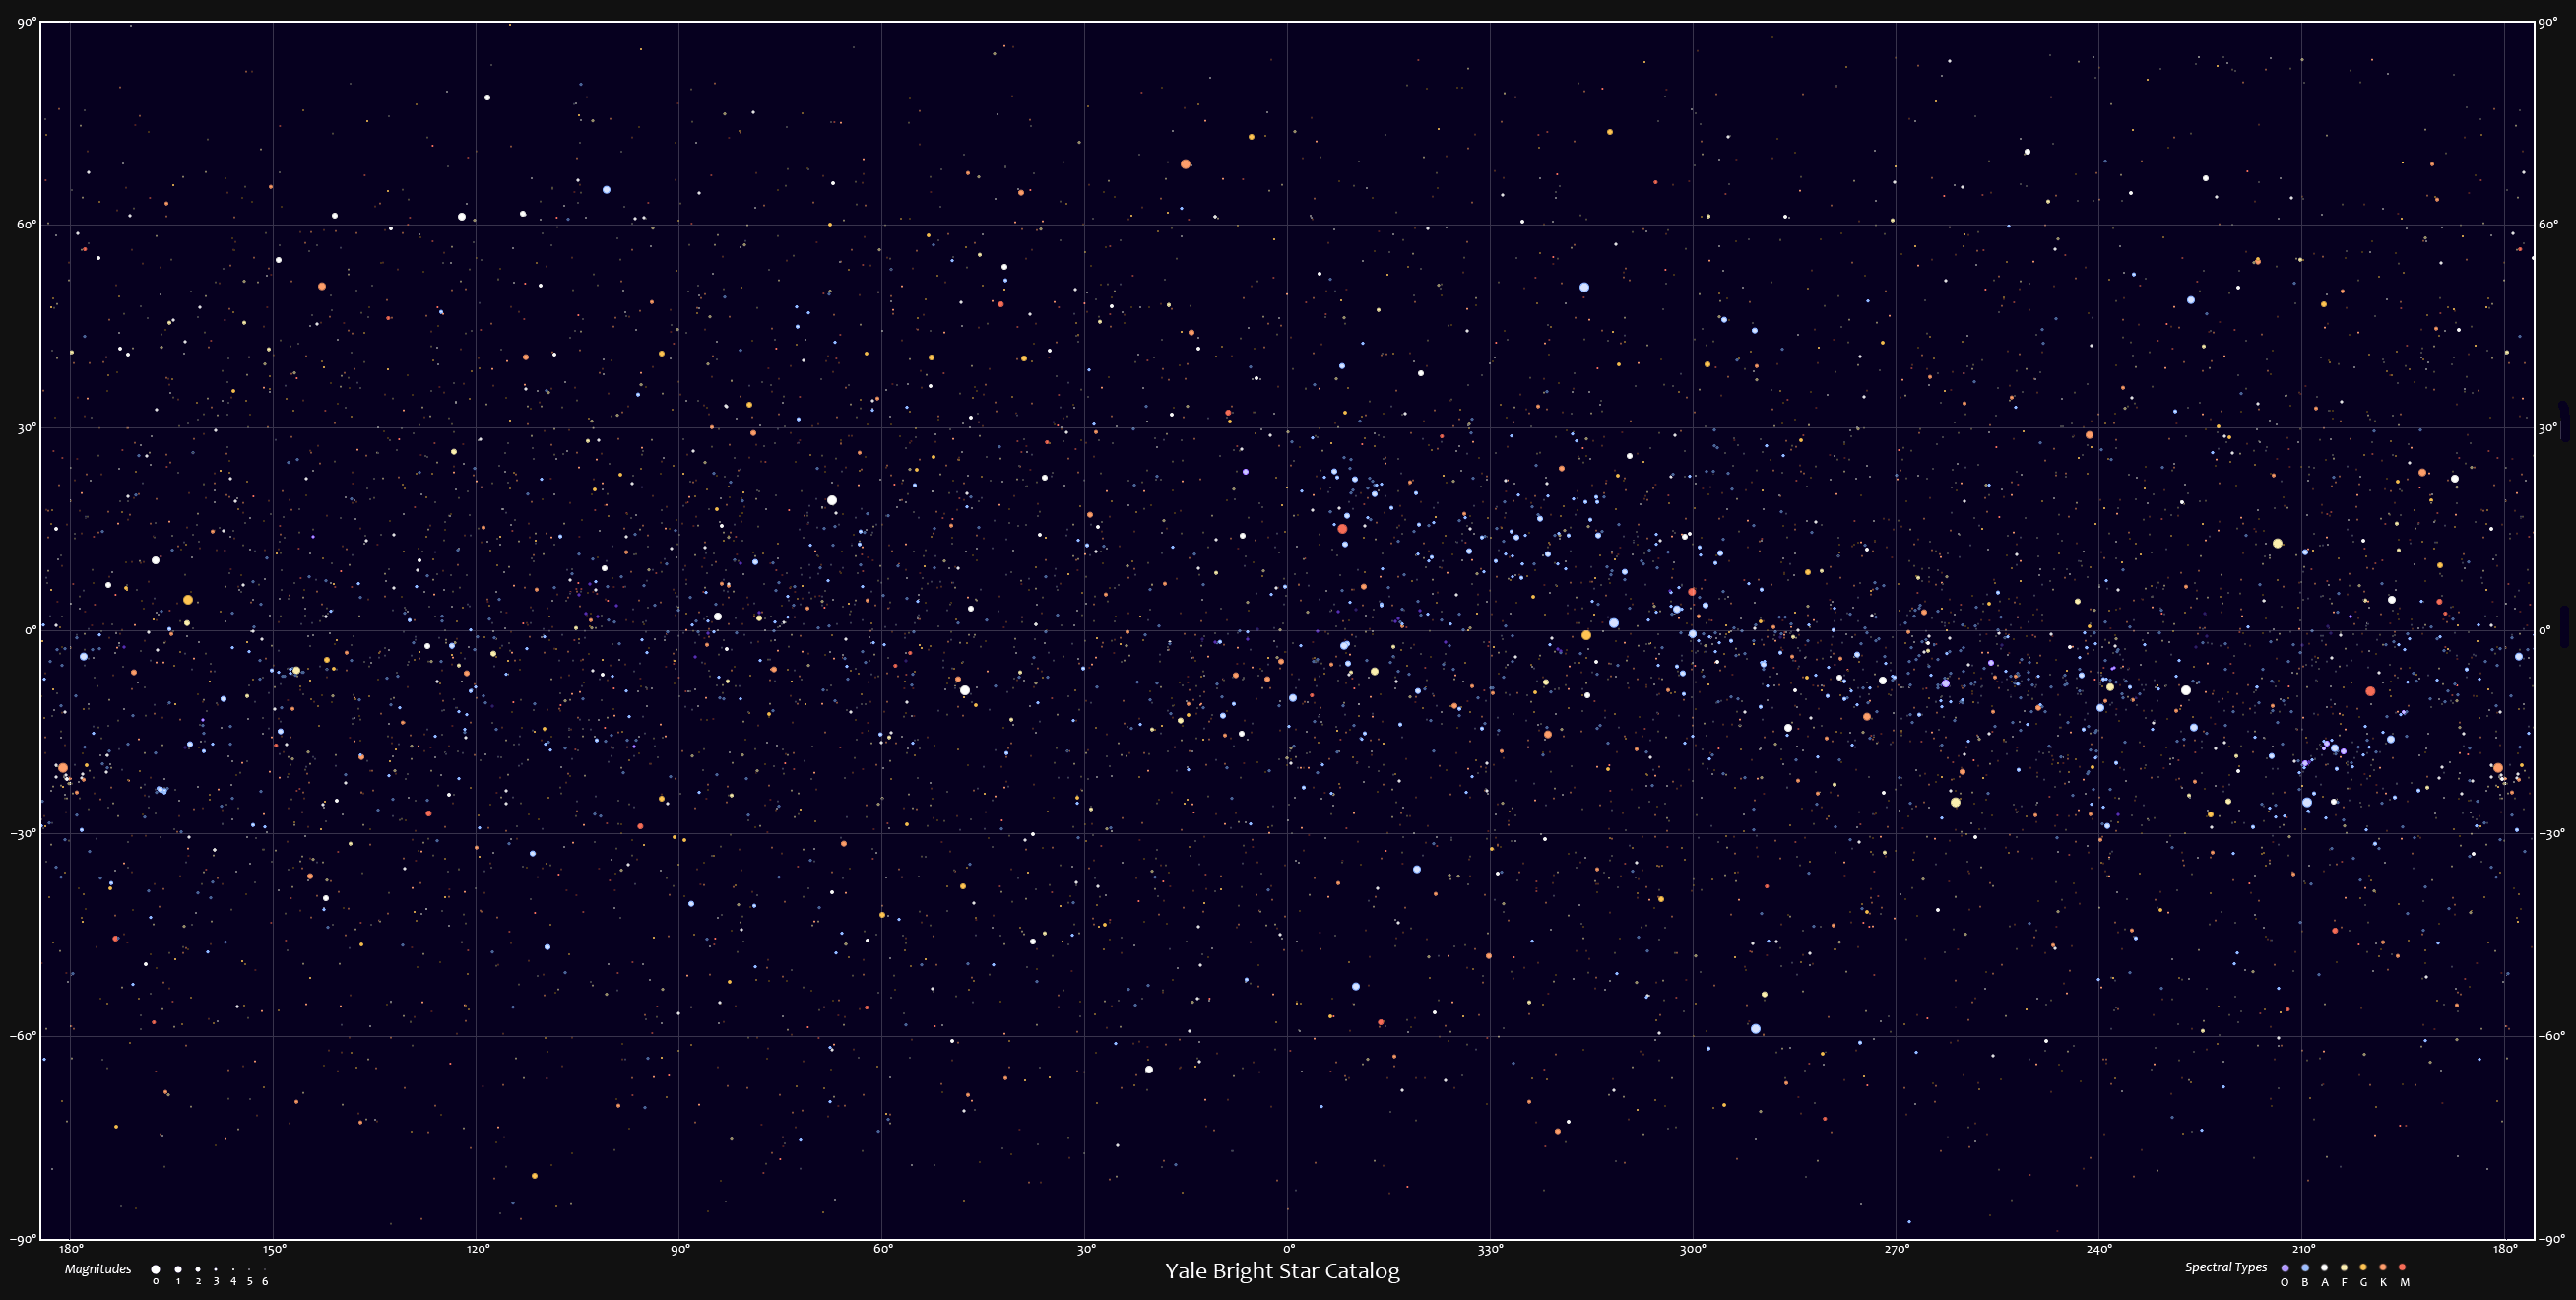
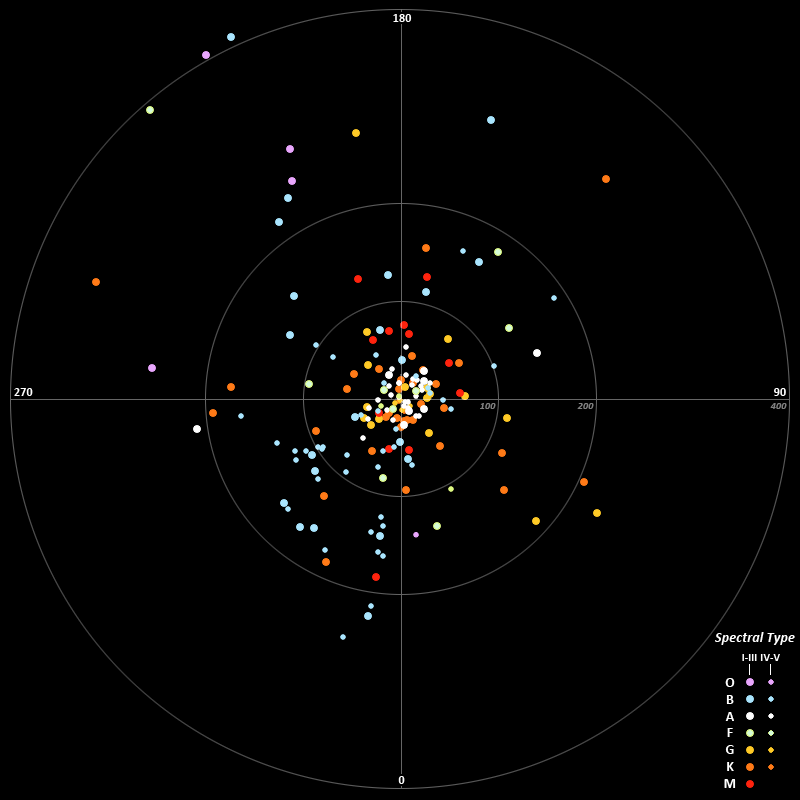
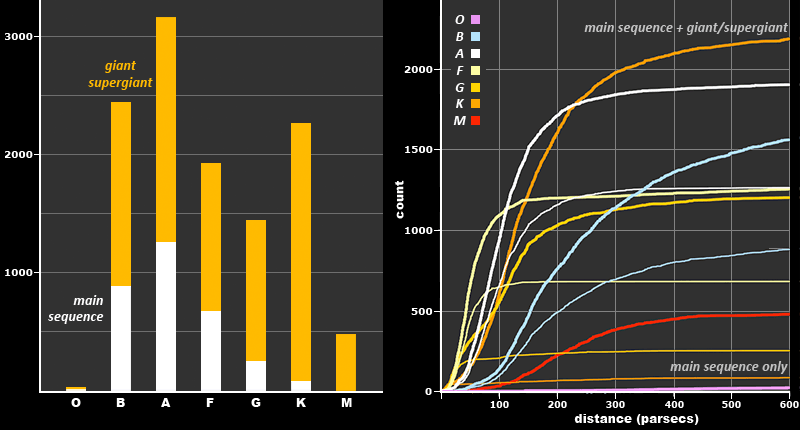
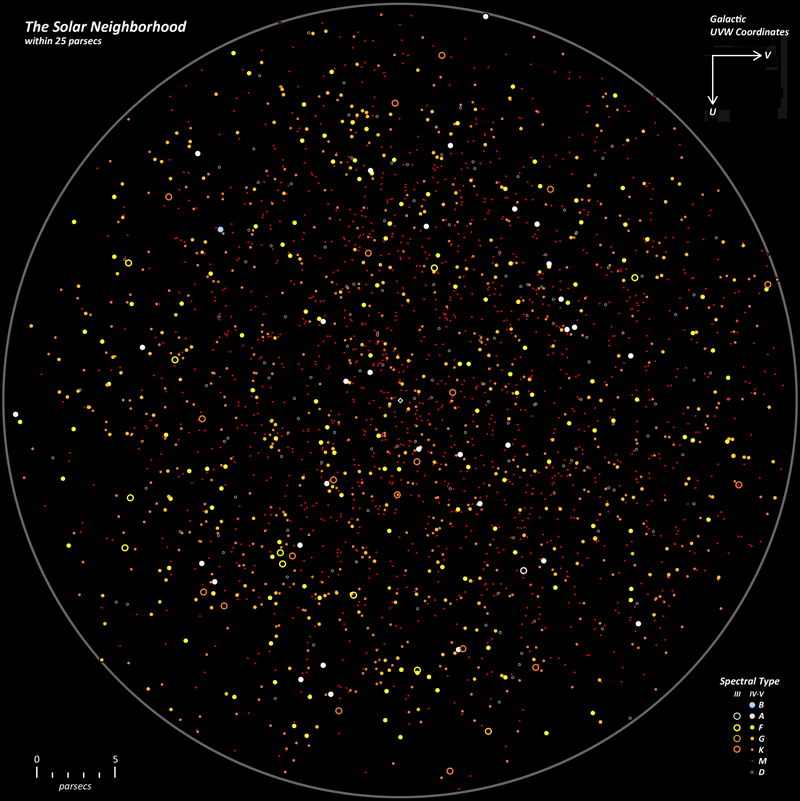
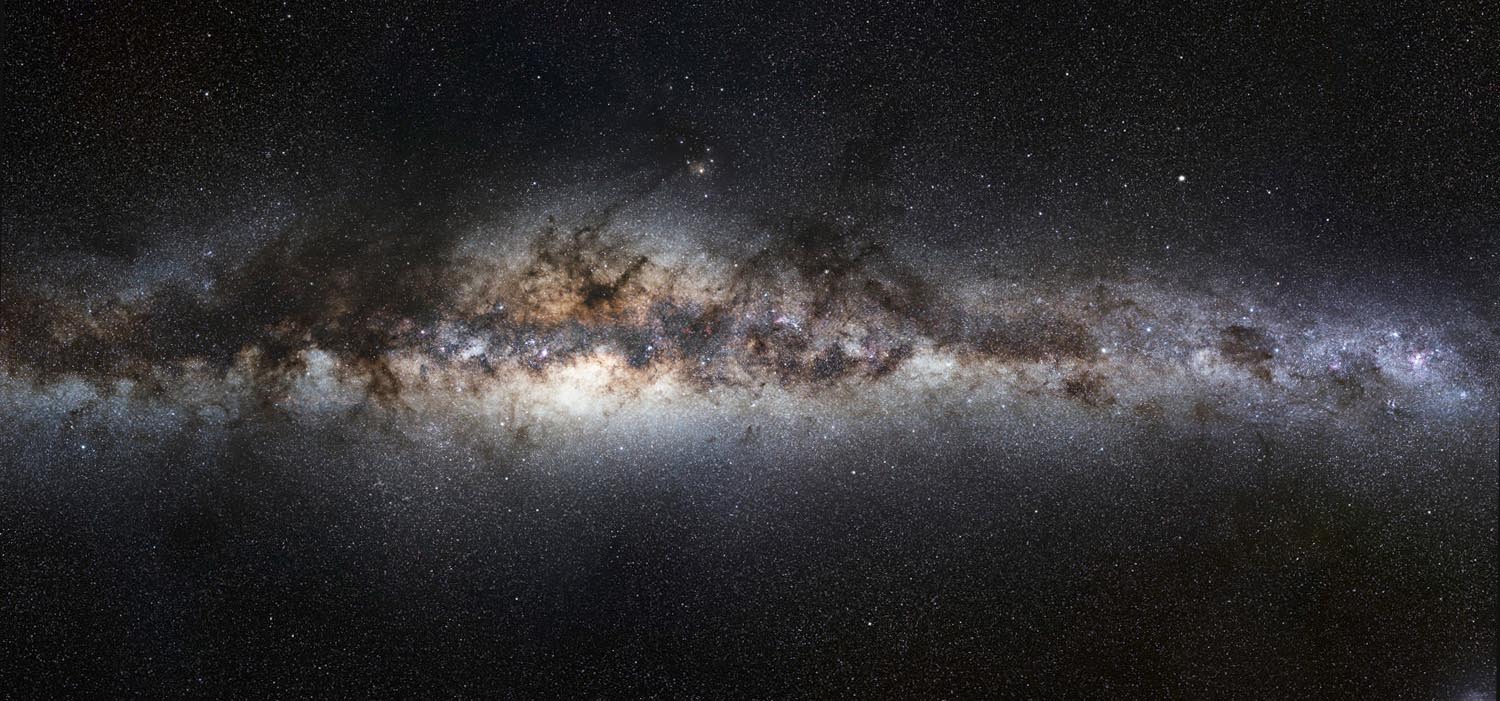
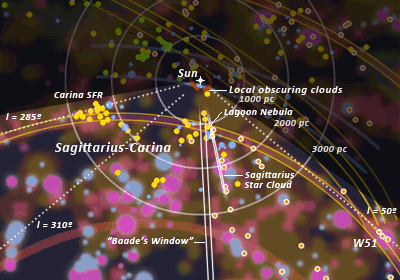
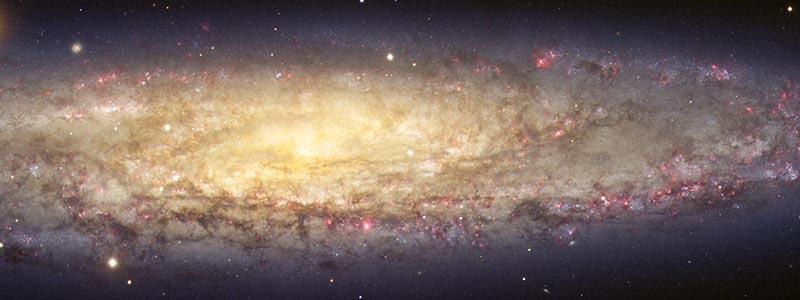
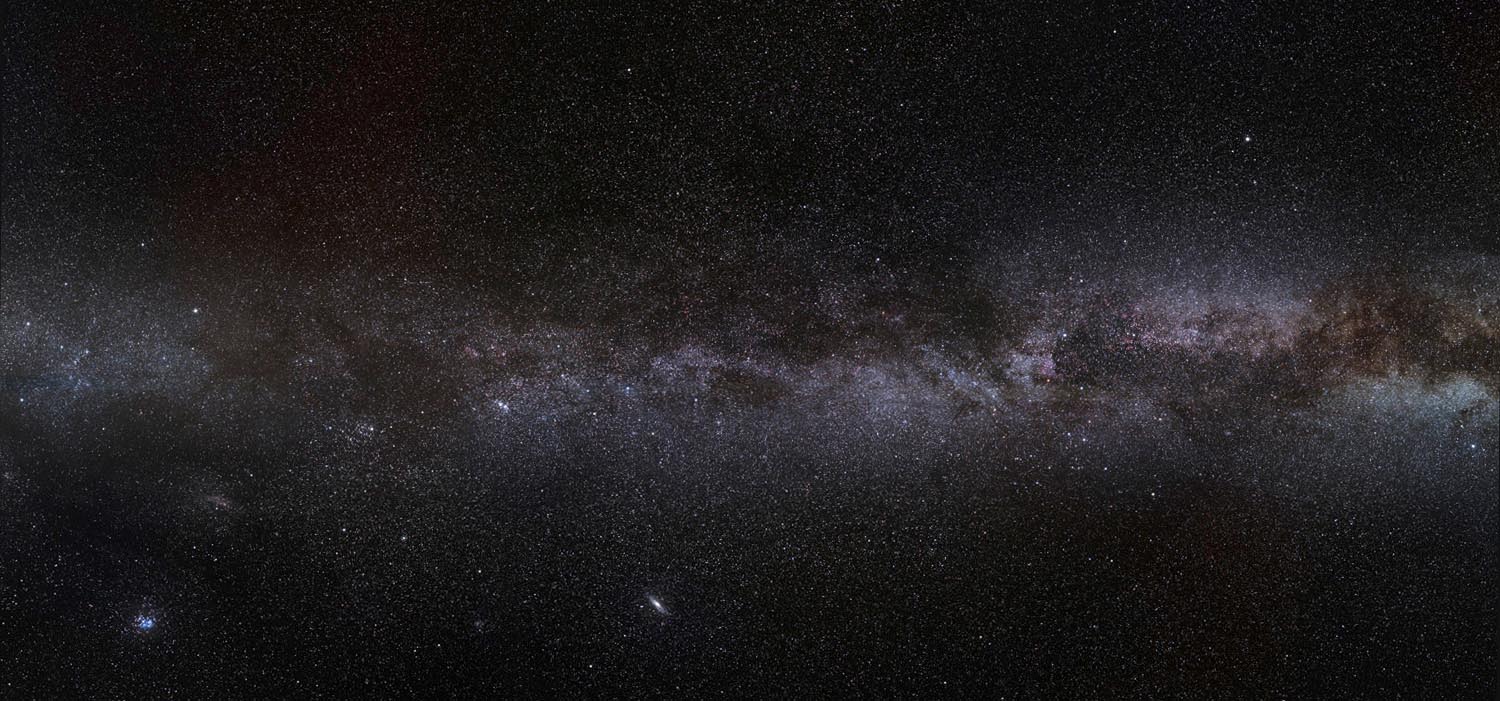
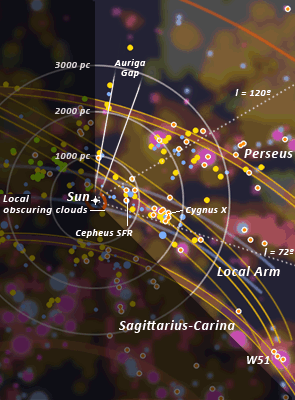
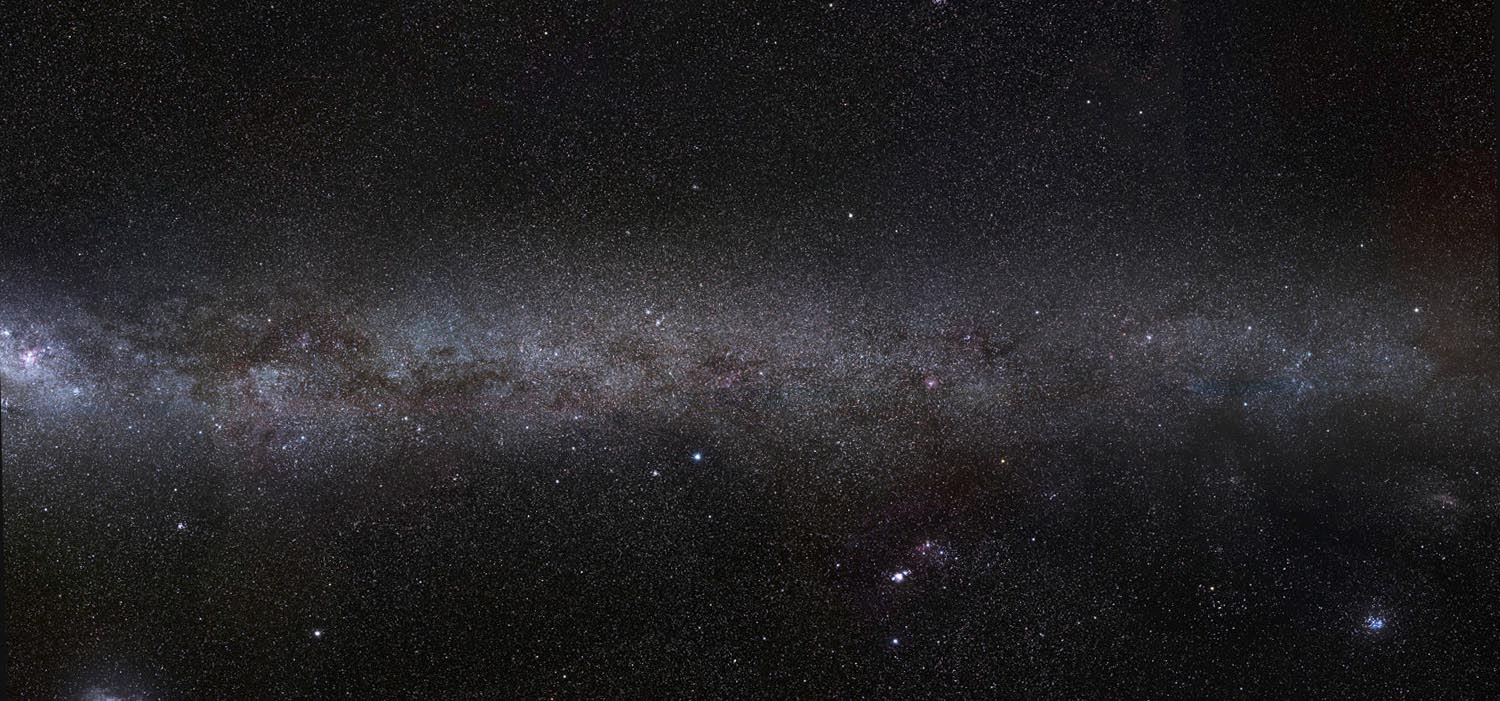
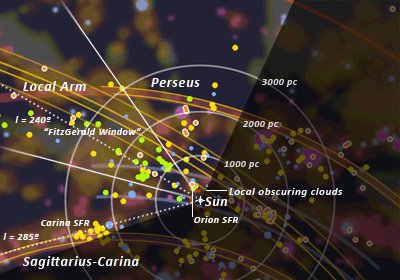
